Understanding Data Cleaning and AI in Production Environments
Introduction to Productivity Data
In the fast-paced world of production, data plays a crucial role in driving efficiency and decision-making. This blog post will explore how to effectively clean and analyze productivity data, particularly in the context of AI integration. We will also touch on the importance of data encryption and the use of AI tools for predictive analysis.
The Importance of Data Cleaning
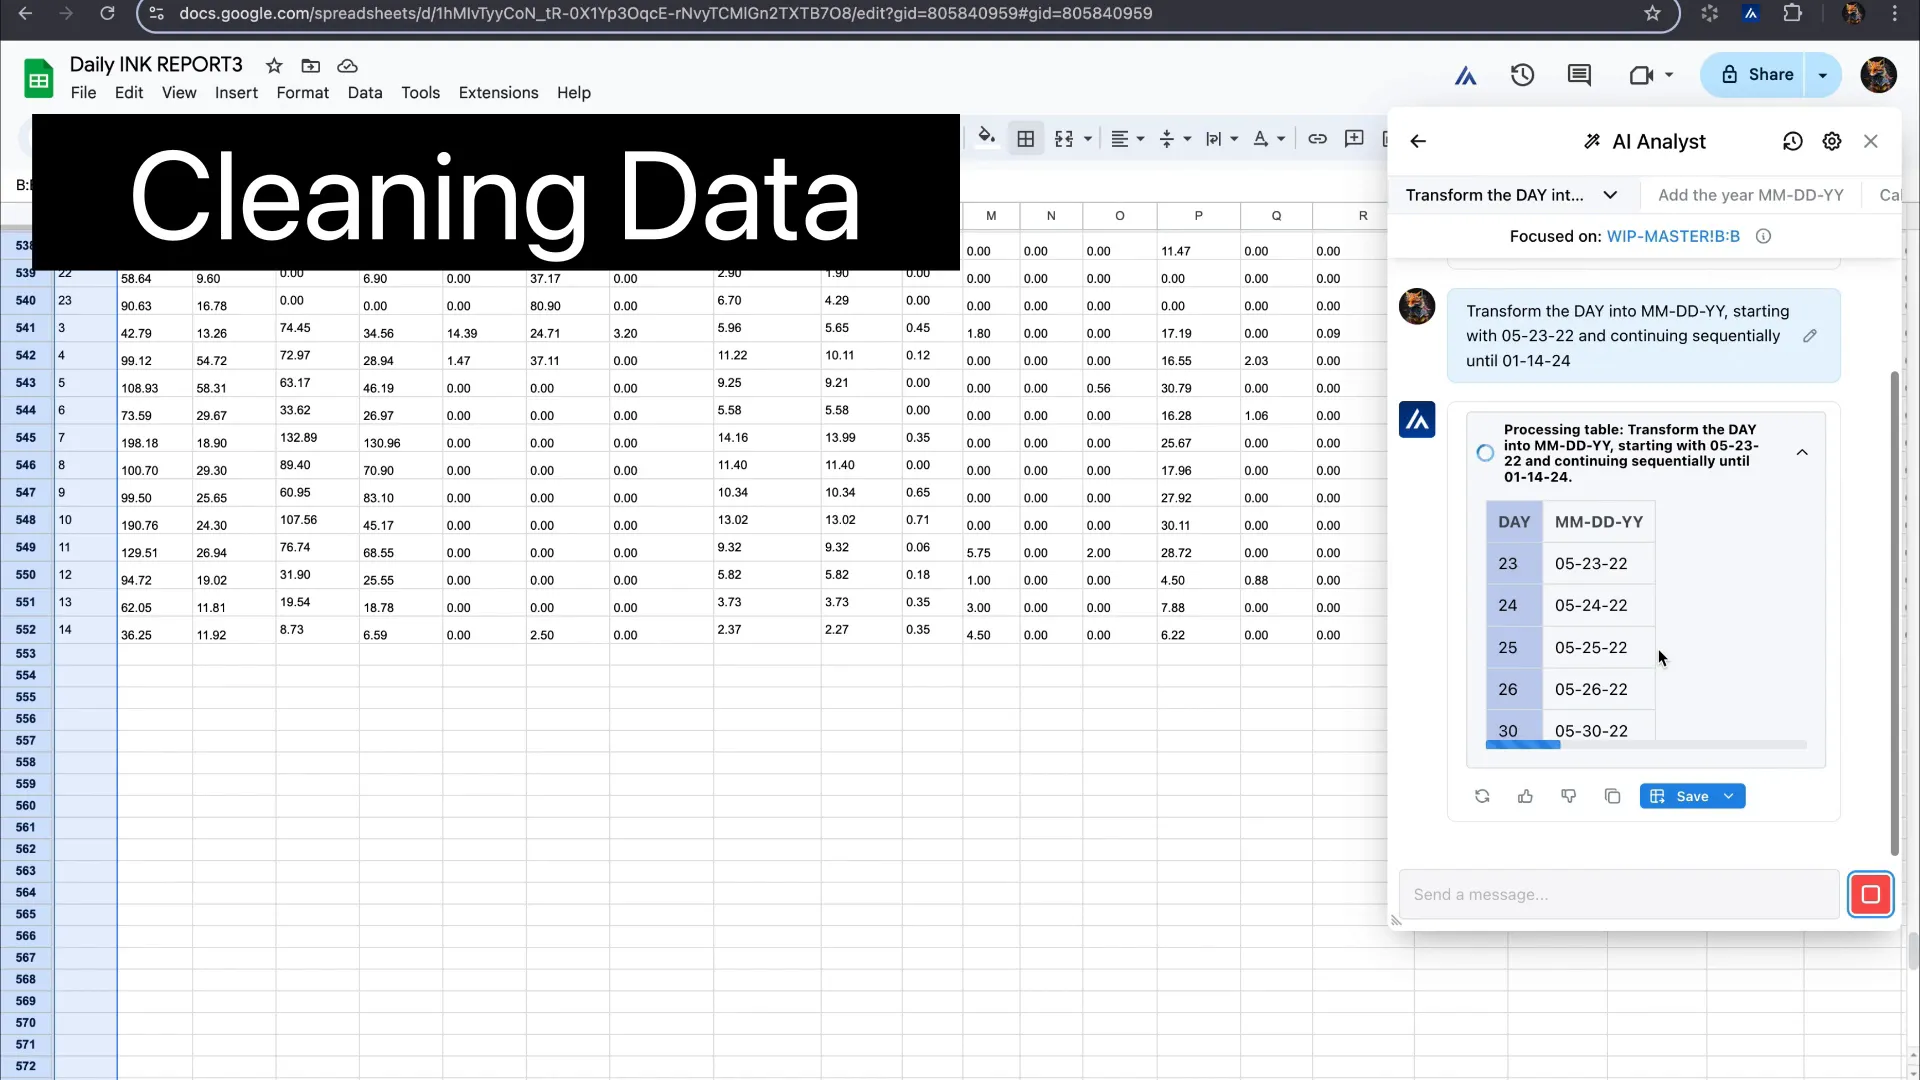
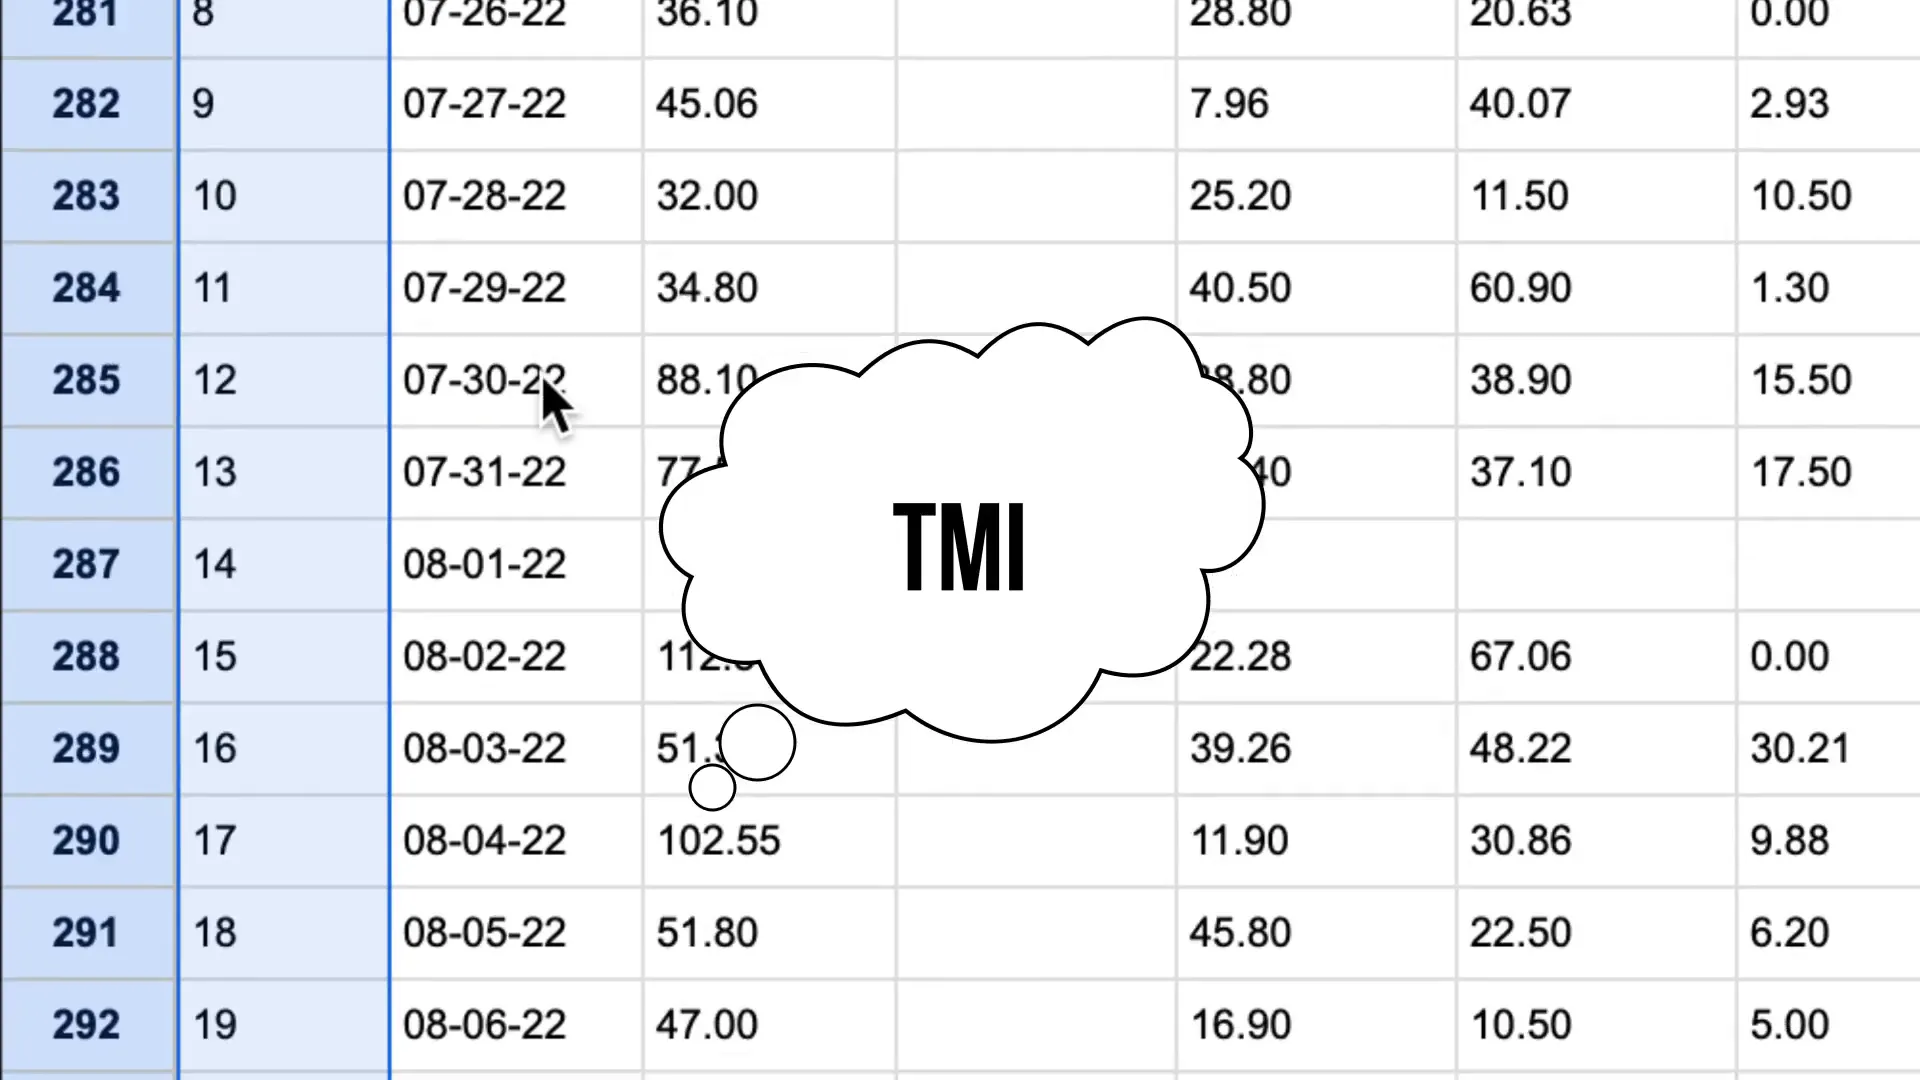
Data cleaning is a fundamental step for any AI system to process data effectively. It involves standardizing various elements such as dates and color names to ensure consistency across datasets. For example, if you have multiple entries for the color navy (like “collegiate navy,” “college navy,” and “navy”), it’s essential to consolidate these into a single category. Otherwise, these variations can lead to skewed results.
Challenges in Data Cleaning
While using AI for data cleaning can be beneficial, it also presents challenges. AI may struggle to understand that different names for the same color refer to the same category. Conversely, two different names for royal might represent distinct colors. Hence, when over-explaining to an AI, it can become confused and less effective. Achieving data cleaning often requires a step-by-step approach, which can be time-consuming.
Data Visualization and Its Efficiency
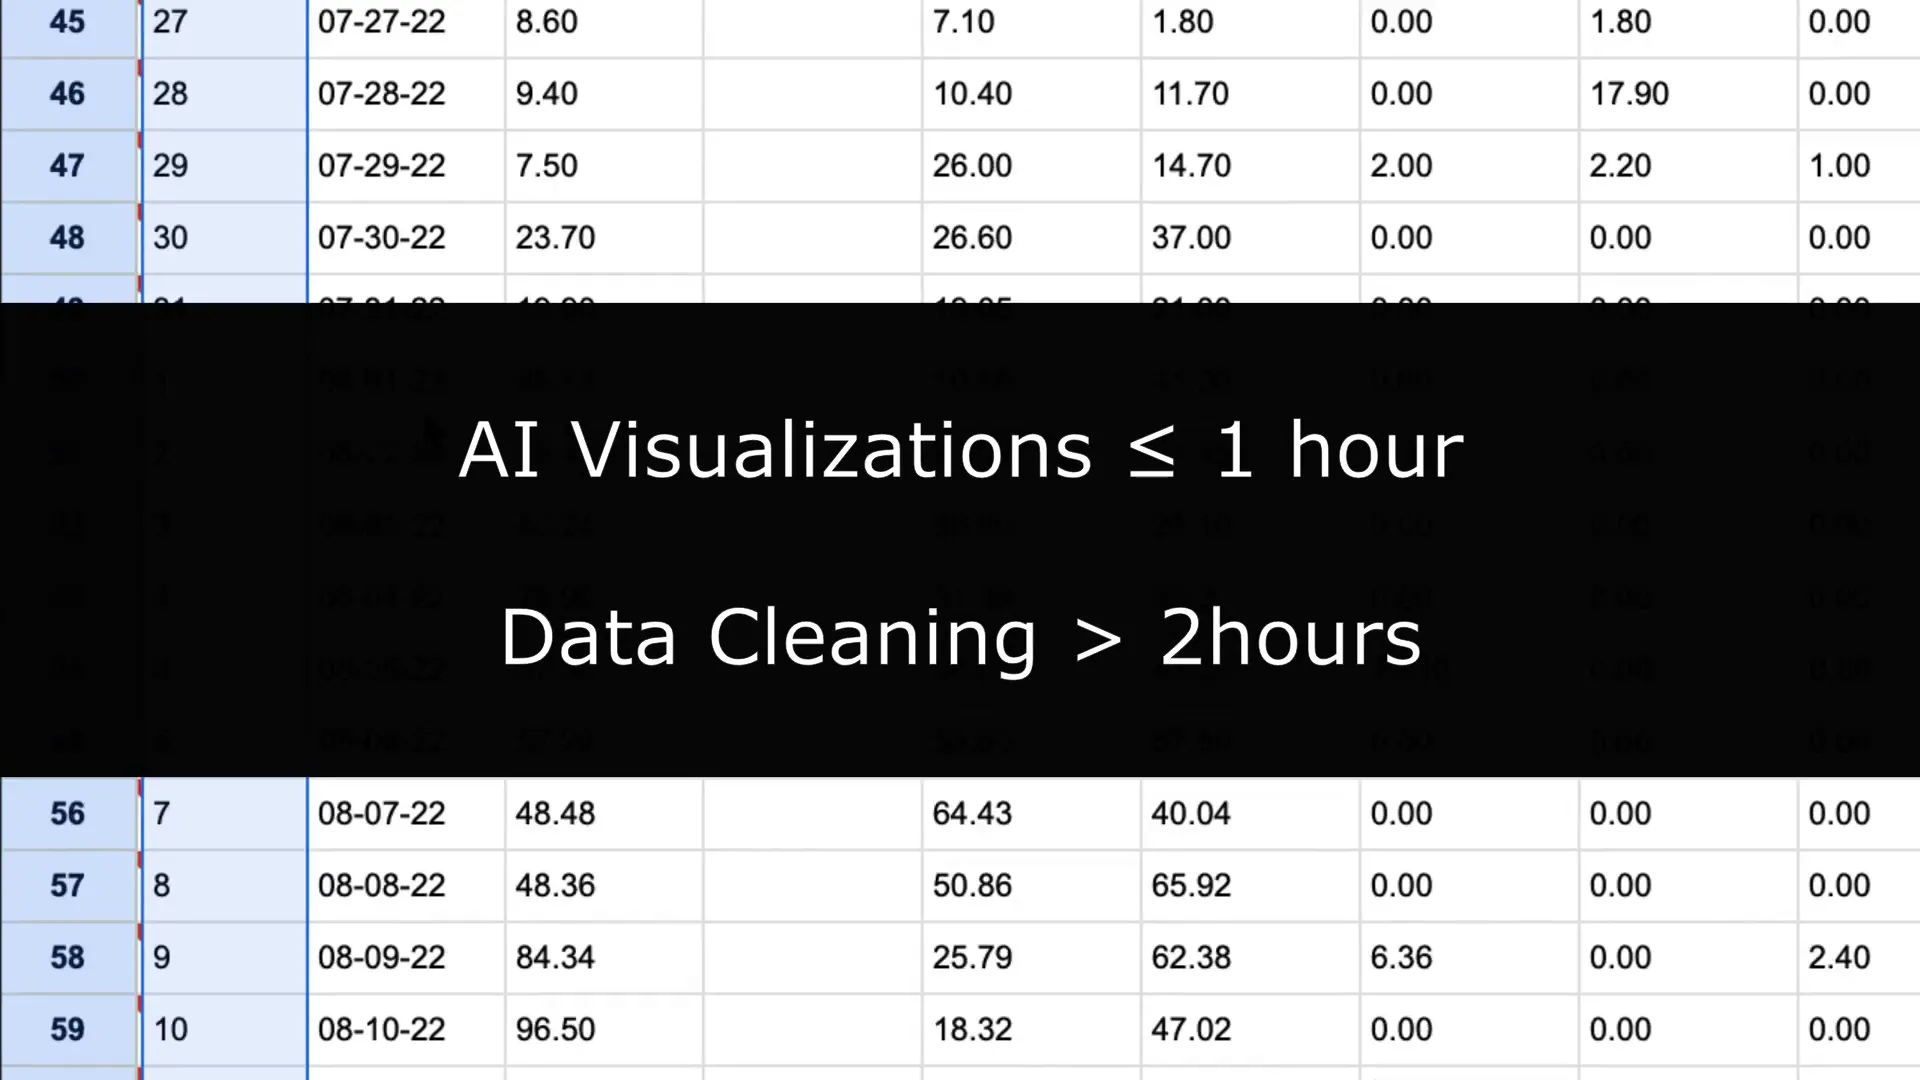
Once the data is cleaned, creating visualizations can be remarkably quick. In fact, it can take less than an hour to generate visual representations of cleaned data. However, the cleaning process itself can take several hours, highlighting the importance of efficient data management strategies.
Integrating AI with Google Sheets
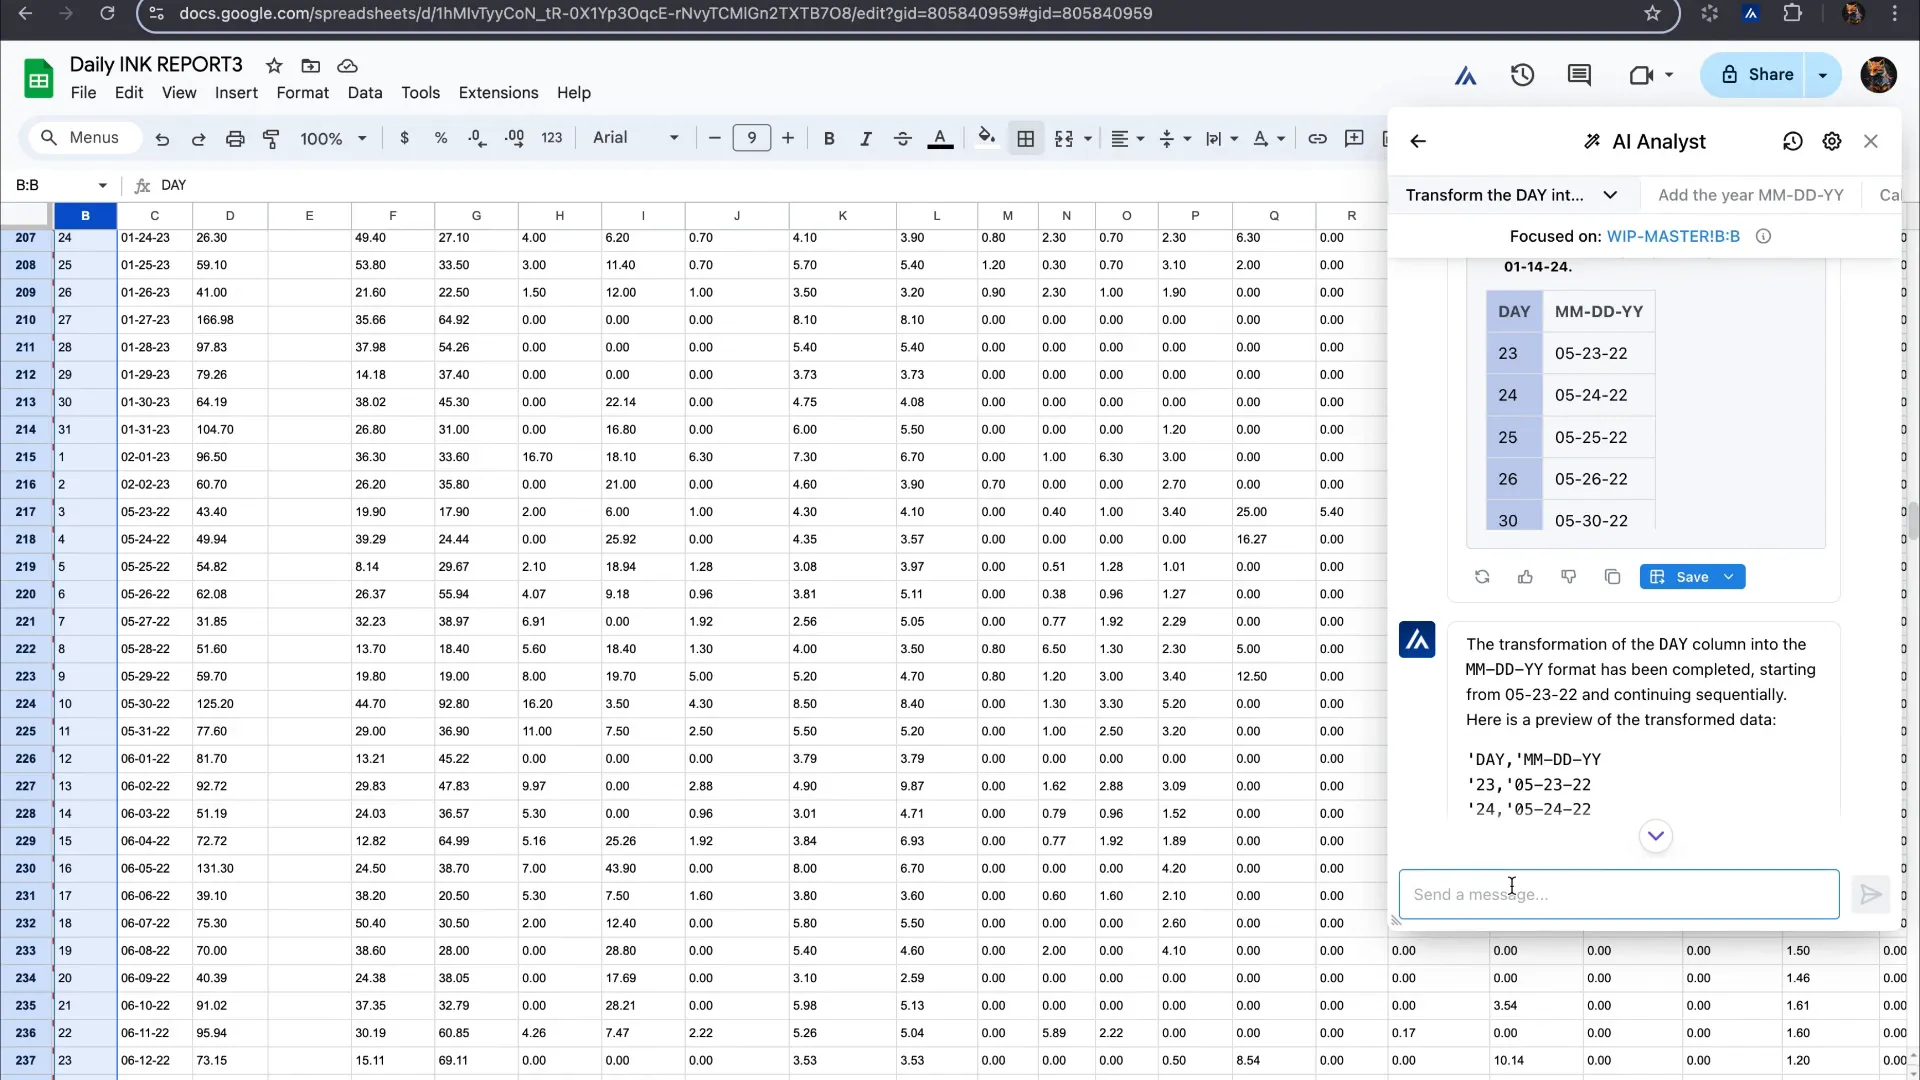
Integrating AI with tools like Google Sheets can significantly enhance productivity. By connecting an AI to your spreadsheet, you can analyze data and generate visualizations that inform decision-making on the production floor. This integration can also be tied back to a manager agent for an automated approach to tracking productivity.
The Role of Predictive Analysis
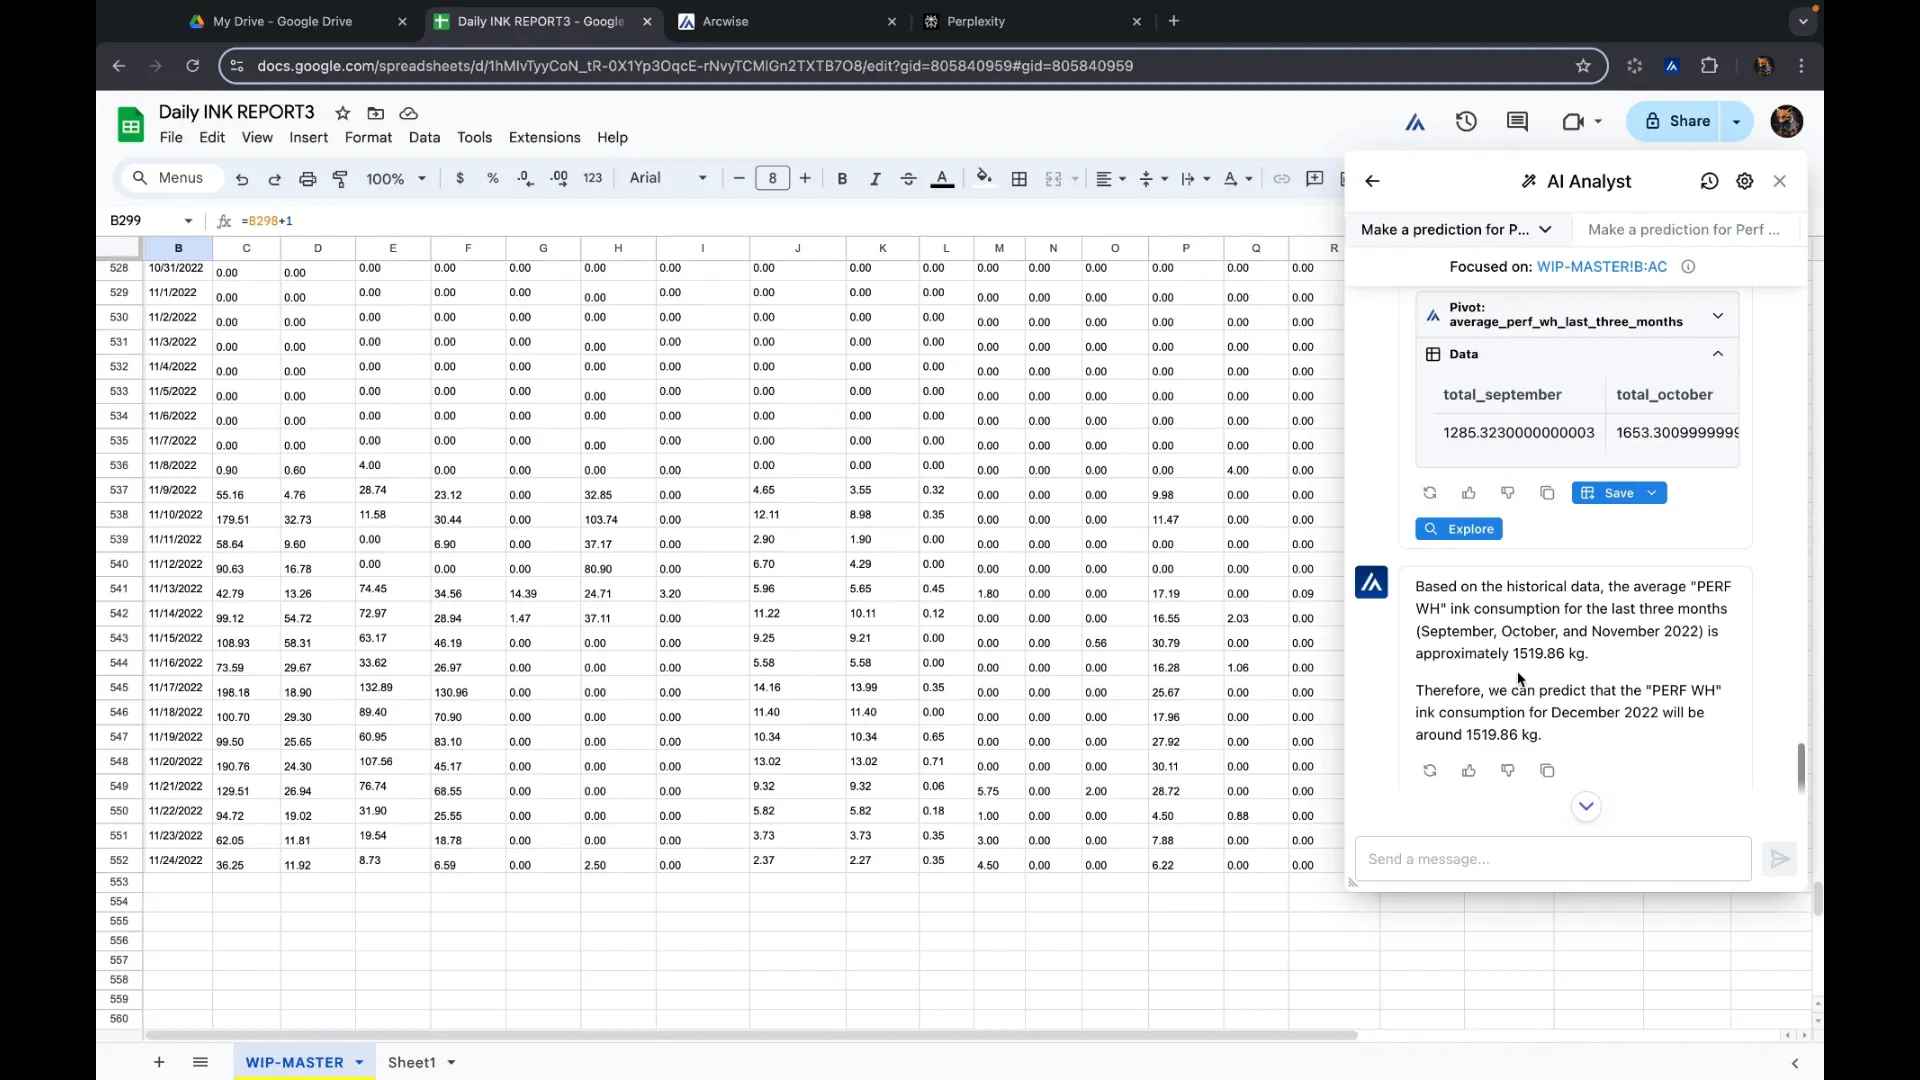
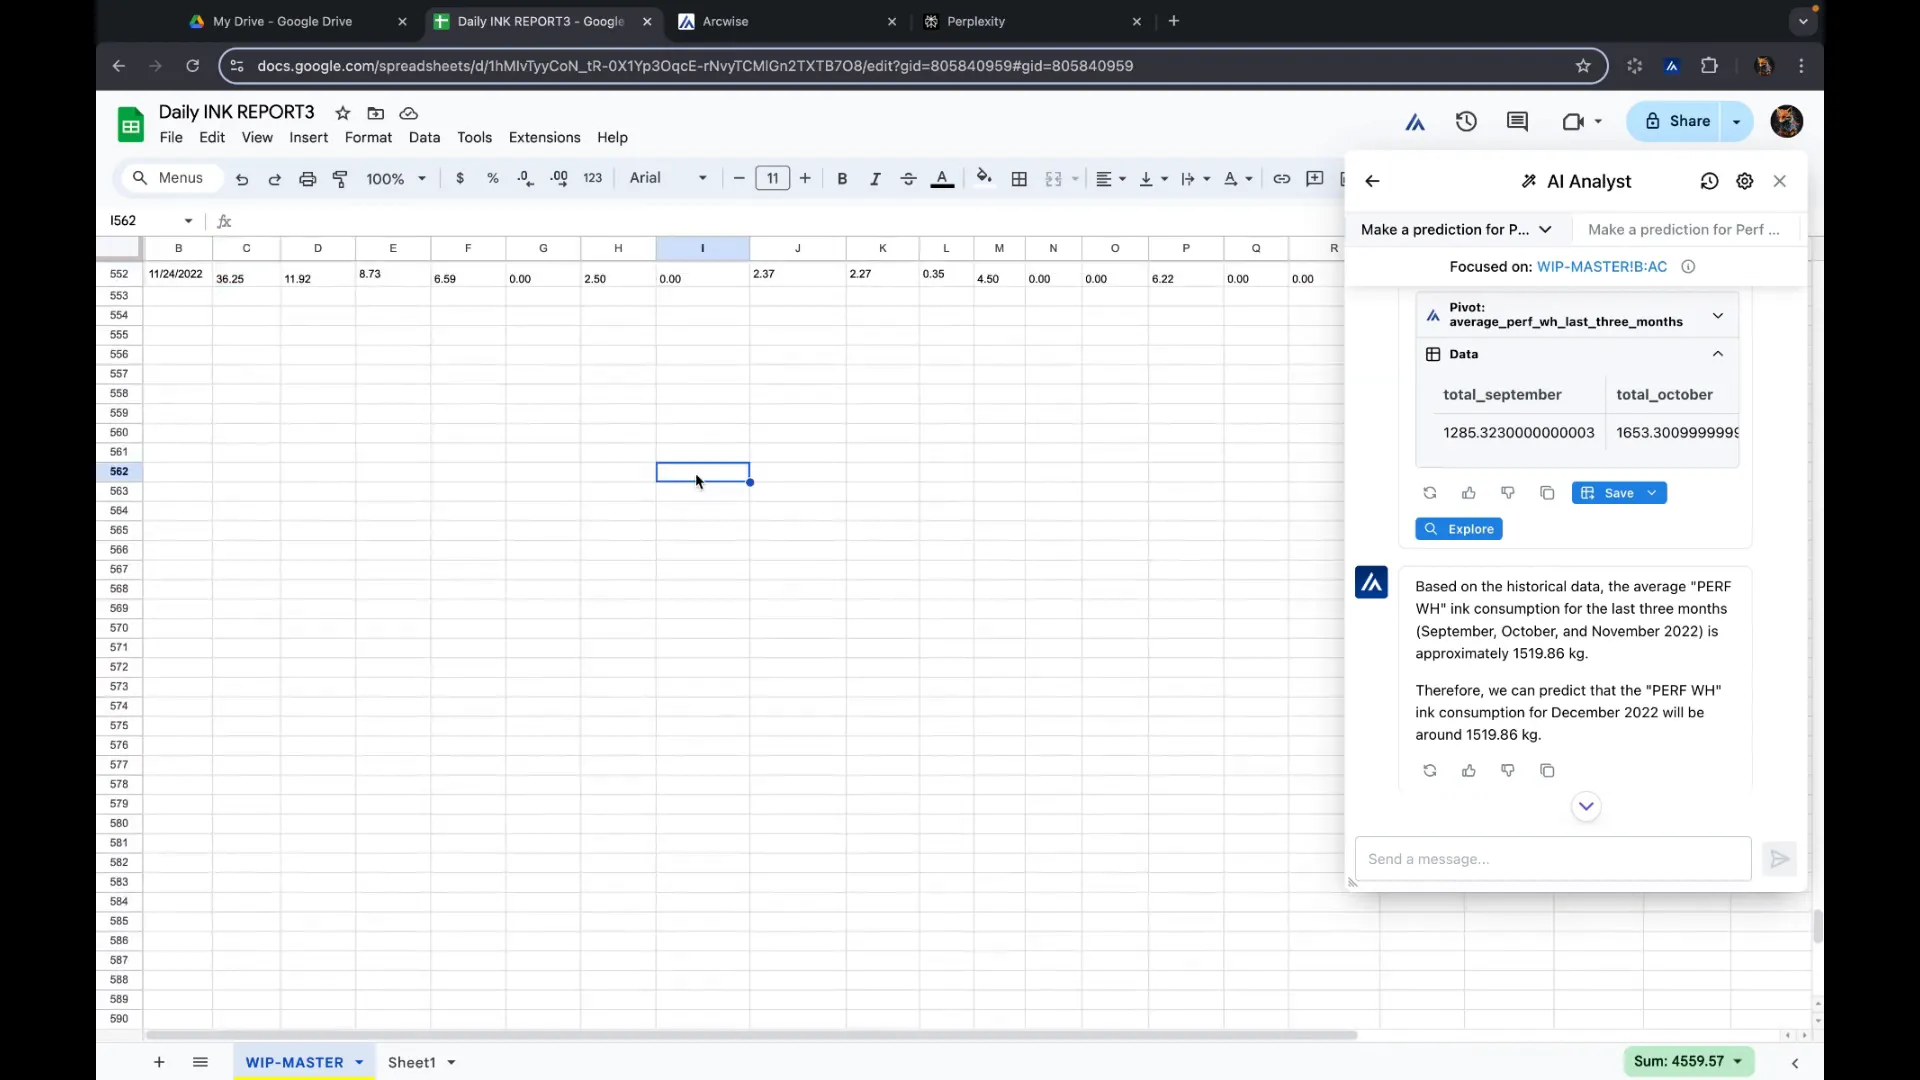
One of the most impressive capabilities of AI is its predictive analysis. For instance, when estimating the upcoming month’s product needs, an AI can analyze past usage patterns to forecast future requirements. In a recent example, an AI provided an estimate of 1,519 kilograms needed based on the previous three months’ data. This estimation was later verified for accuracy, ensuring that the AI’s calculations were reliable.
Ensuring Accuracy and Reliability
While setting up autonomous systems, it is crucial to maintain checks and balances. Even with AI, verifying the accuracy of predictions is necessary to avoid hallucinations or erroneous outputs. This process helps in building trust in the AI’s recommendations.
Identifying Anomalies in Data
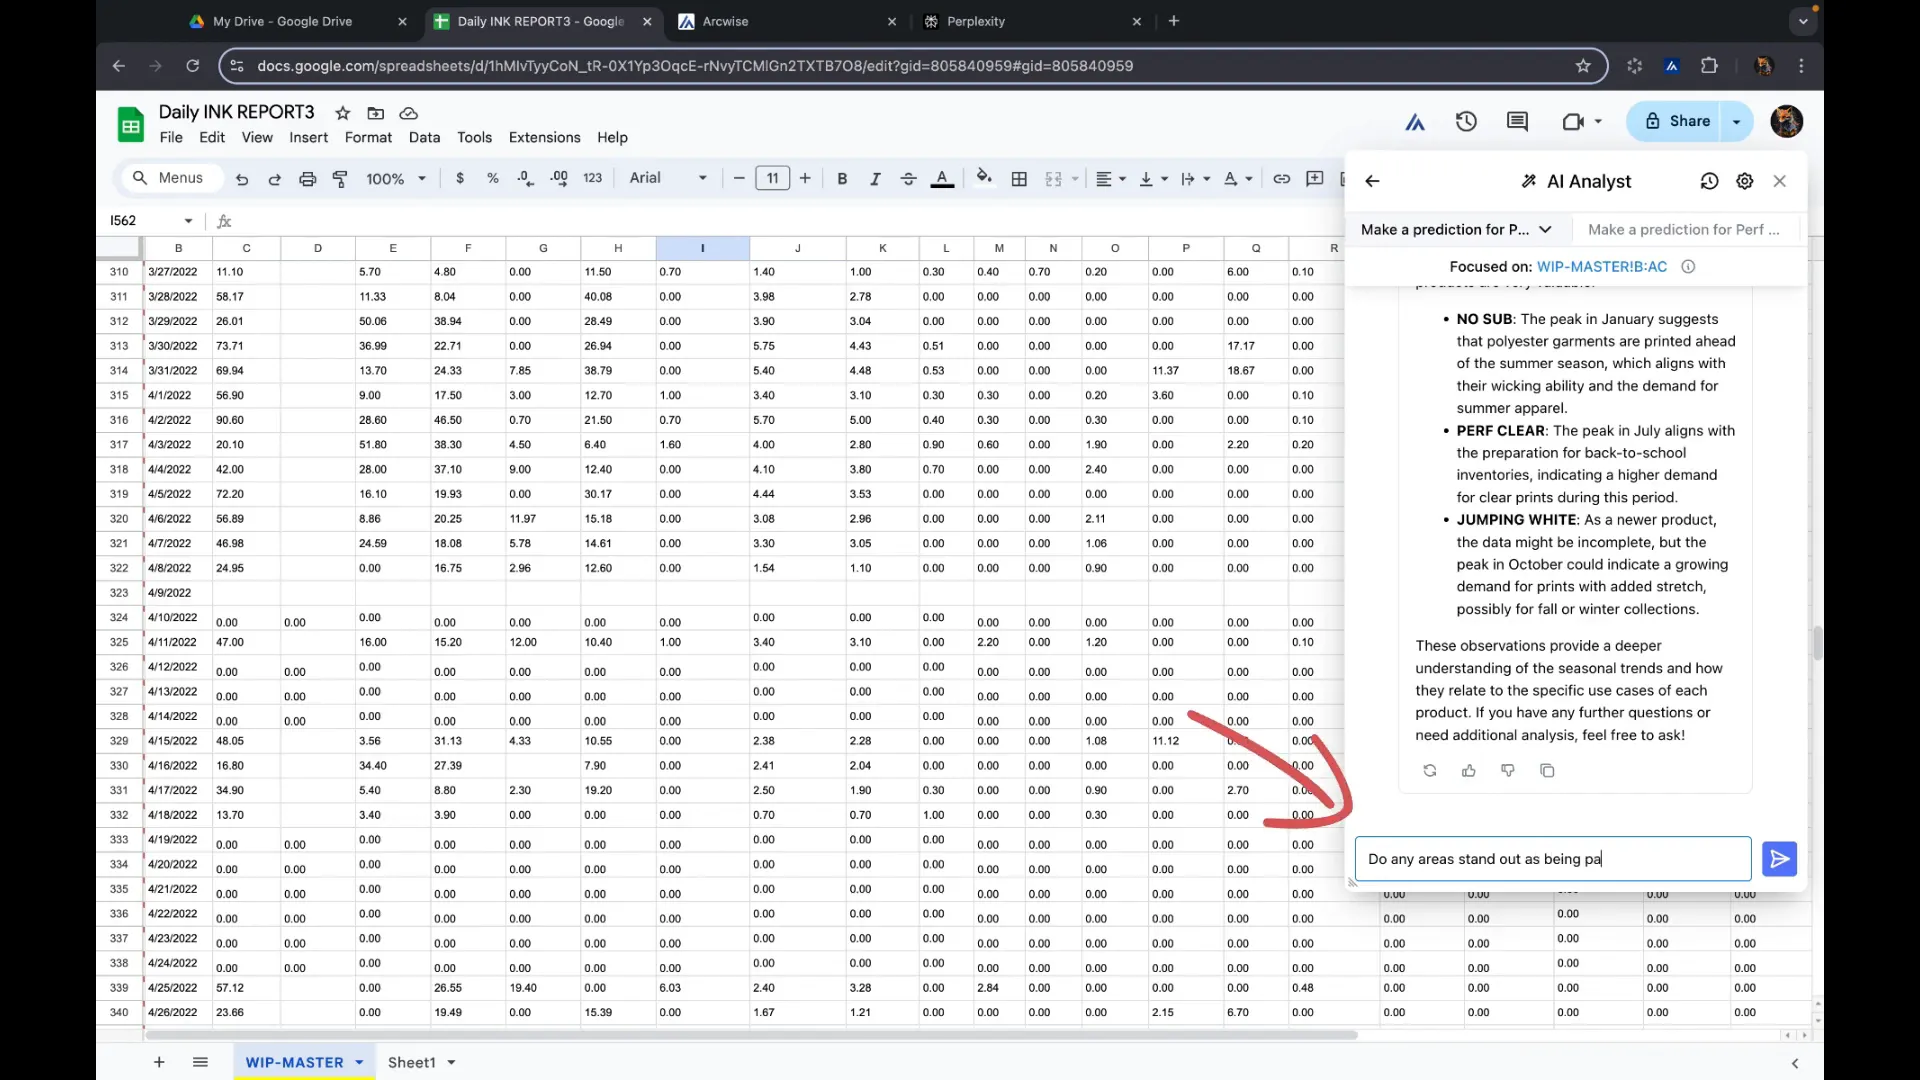
Another key feature of AI is its ability to identify anomalies. For example, when analyzing consumption data, the AI flagged two products that exhibited unusual patterns. One was a new product with limited data, while the other showed unexpected peaks in consumption. This functionality is vital for understanding fluctuations in production and addressing potential issues proactively.
Utilizing Visual Reports for Insights
Creating various visual reports allows for the analysis of different trends over time. For instance, reports can be generated quarterly to observe trends, fluctuations, and pain points in production. These insights can guide decisions on preventative maintenance and overall operational improvements.
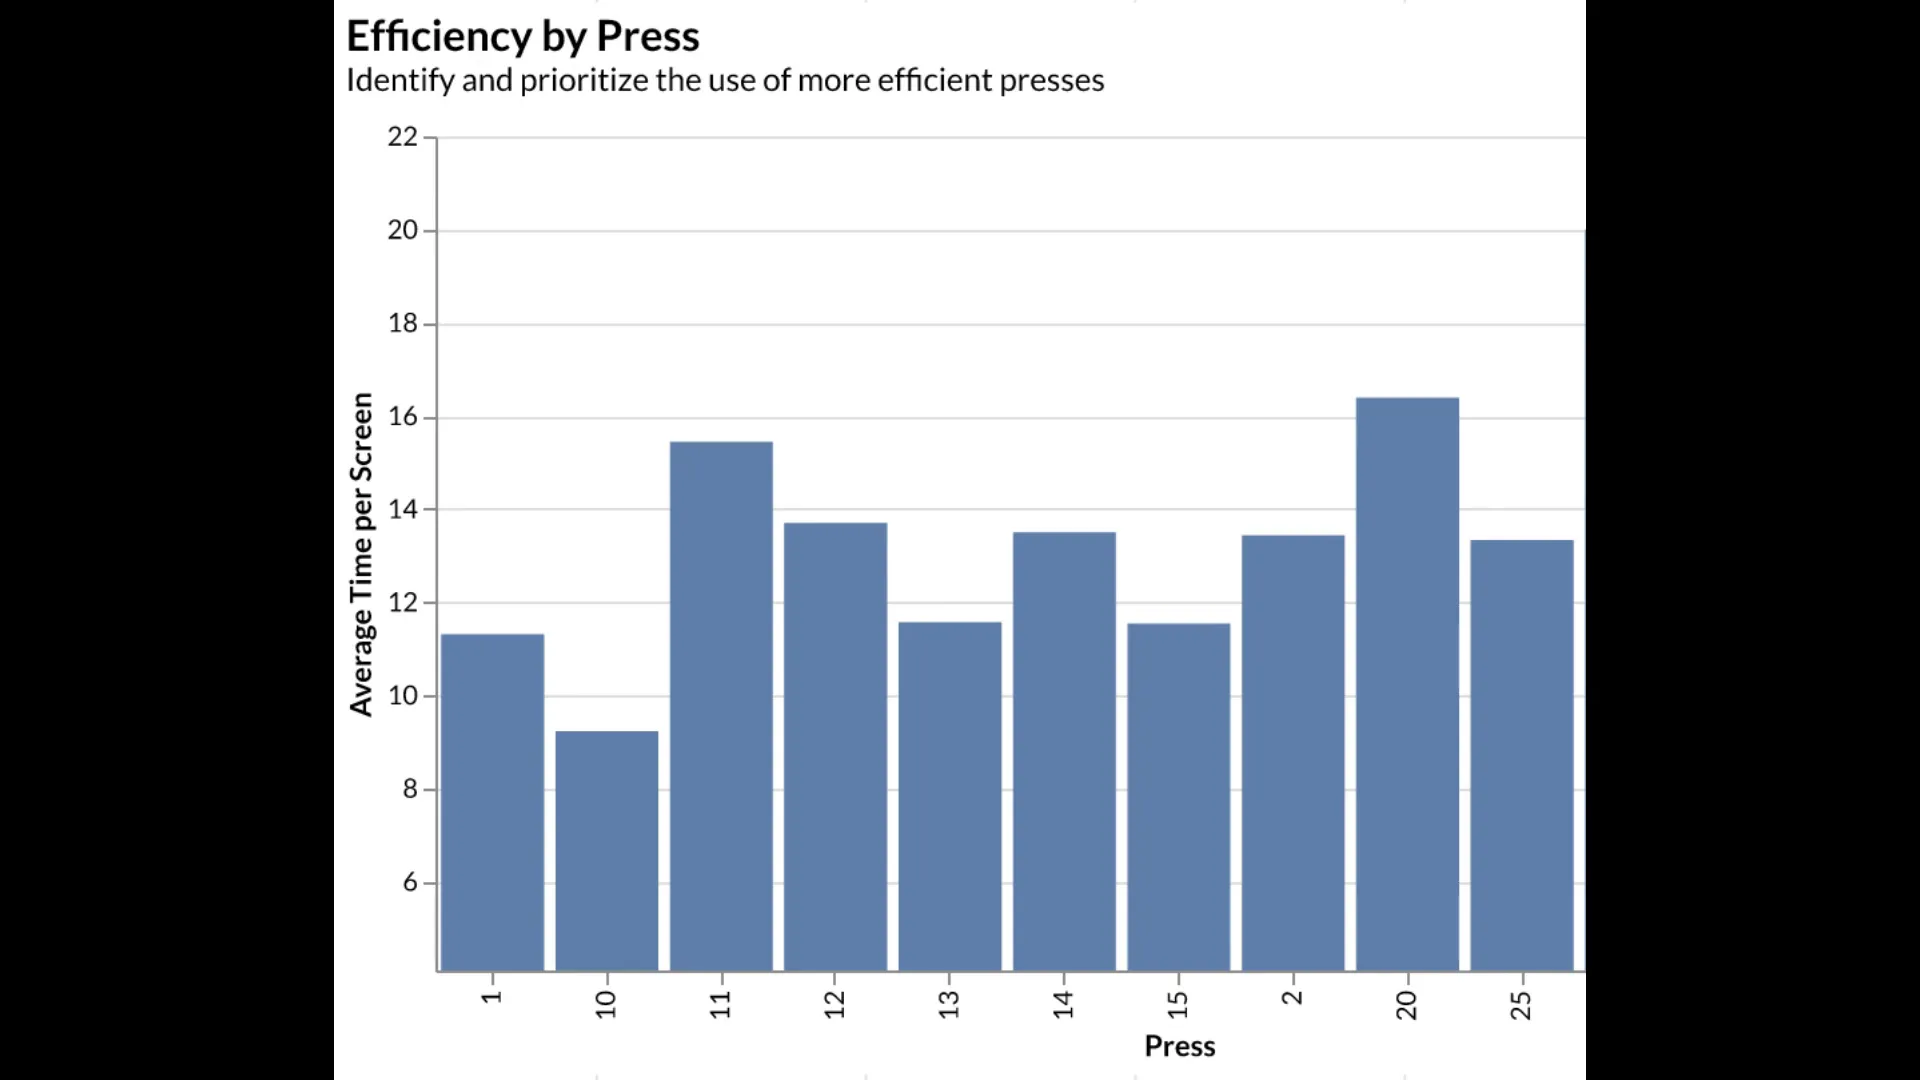
Key Visualizations from Production Data
Several charts can provide valuable insights into production efficiency. For example, a chart showing efficiency by press can help identify underperforming machines, prompting timely preventative maintenance. Another chart correlates setup shirts used over time with other production factors, revealing patterns that can inform operational strategies.
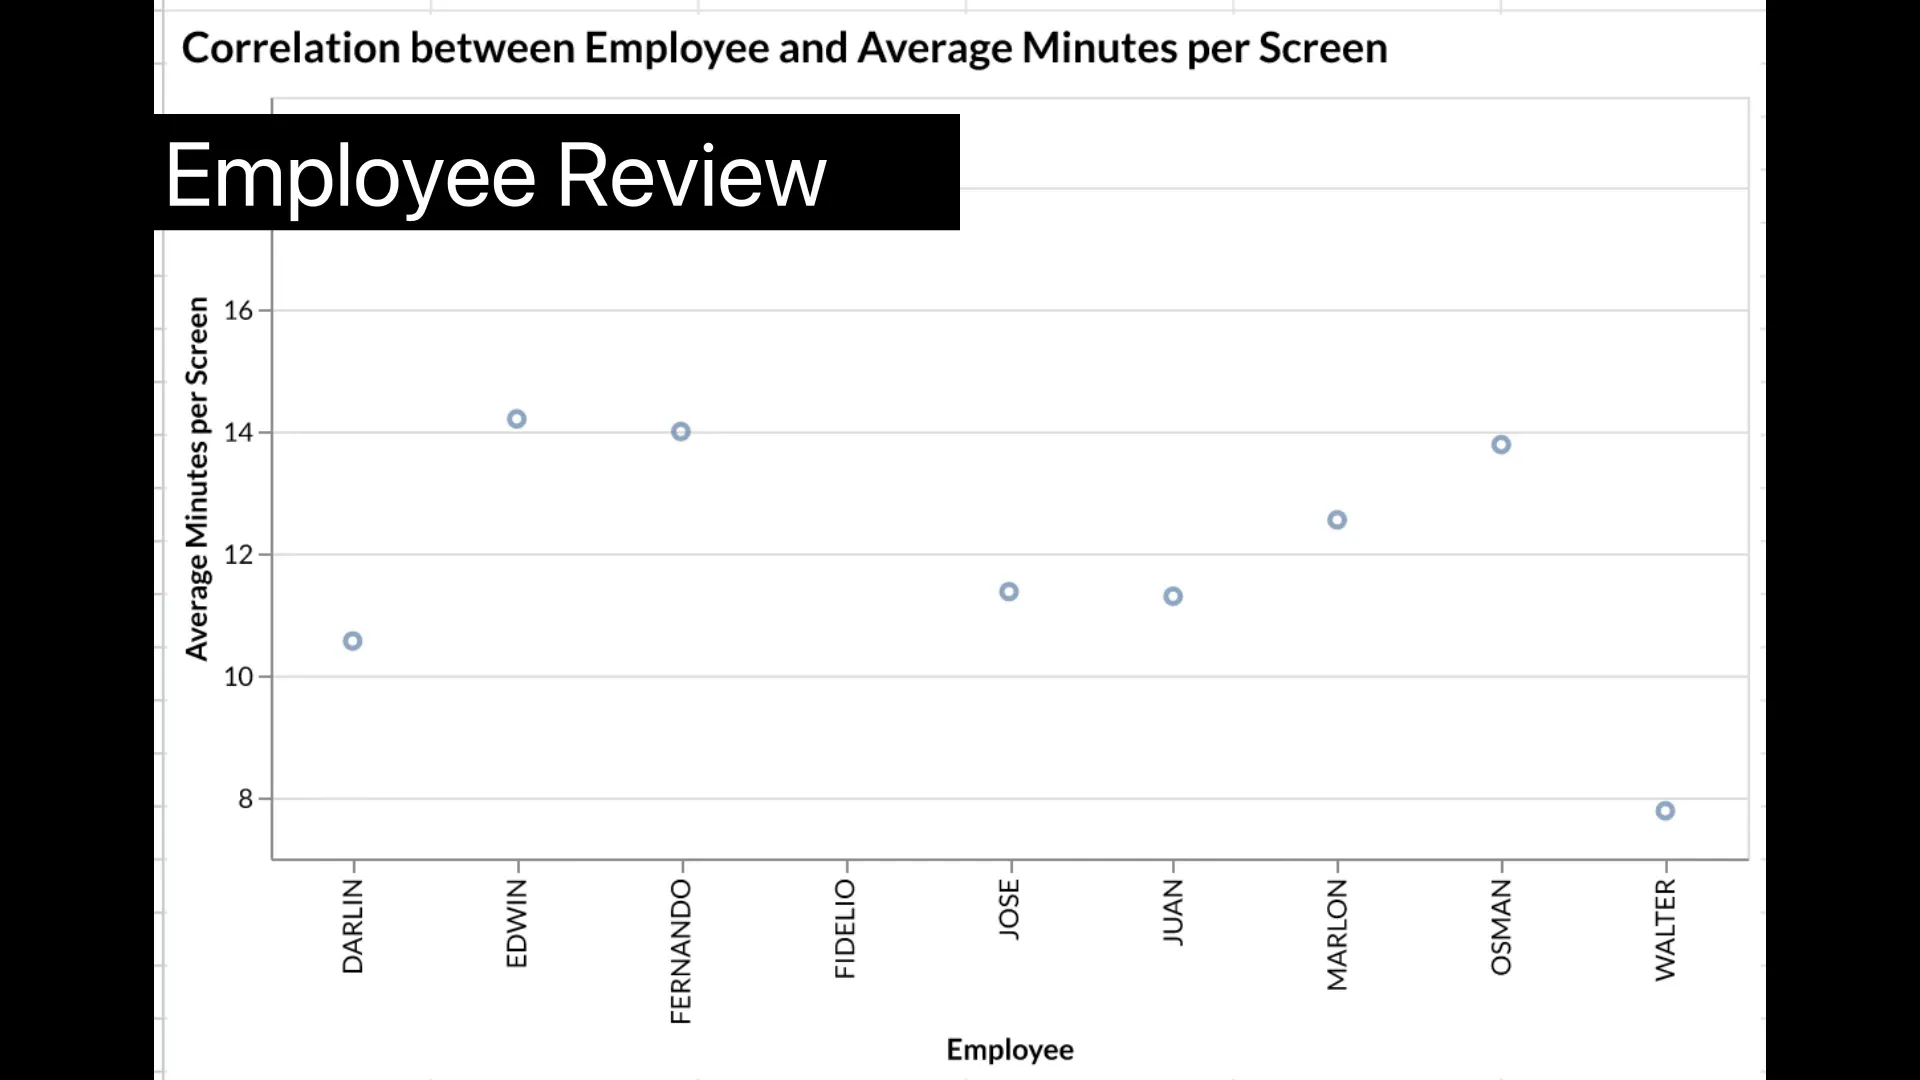
Employee Performance Insights
Visualizations can also be used to assess employee performance. By analyzing average setup times per employee, organizations can identify skill levels and training needs. This helps in optimizing workforce management and enhancing overall productivity.
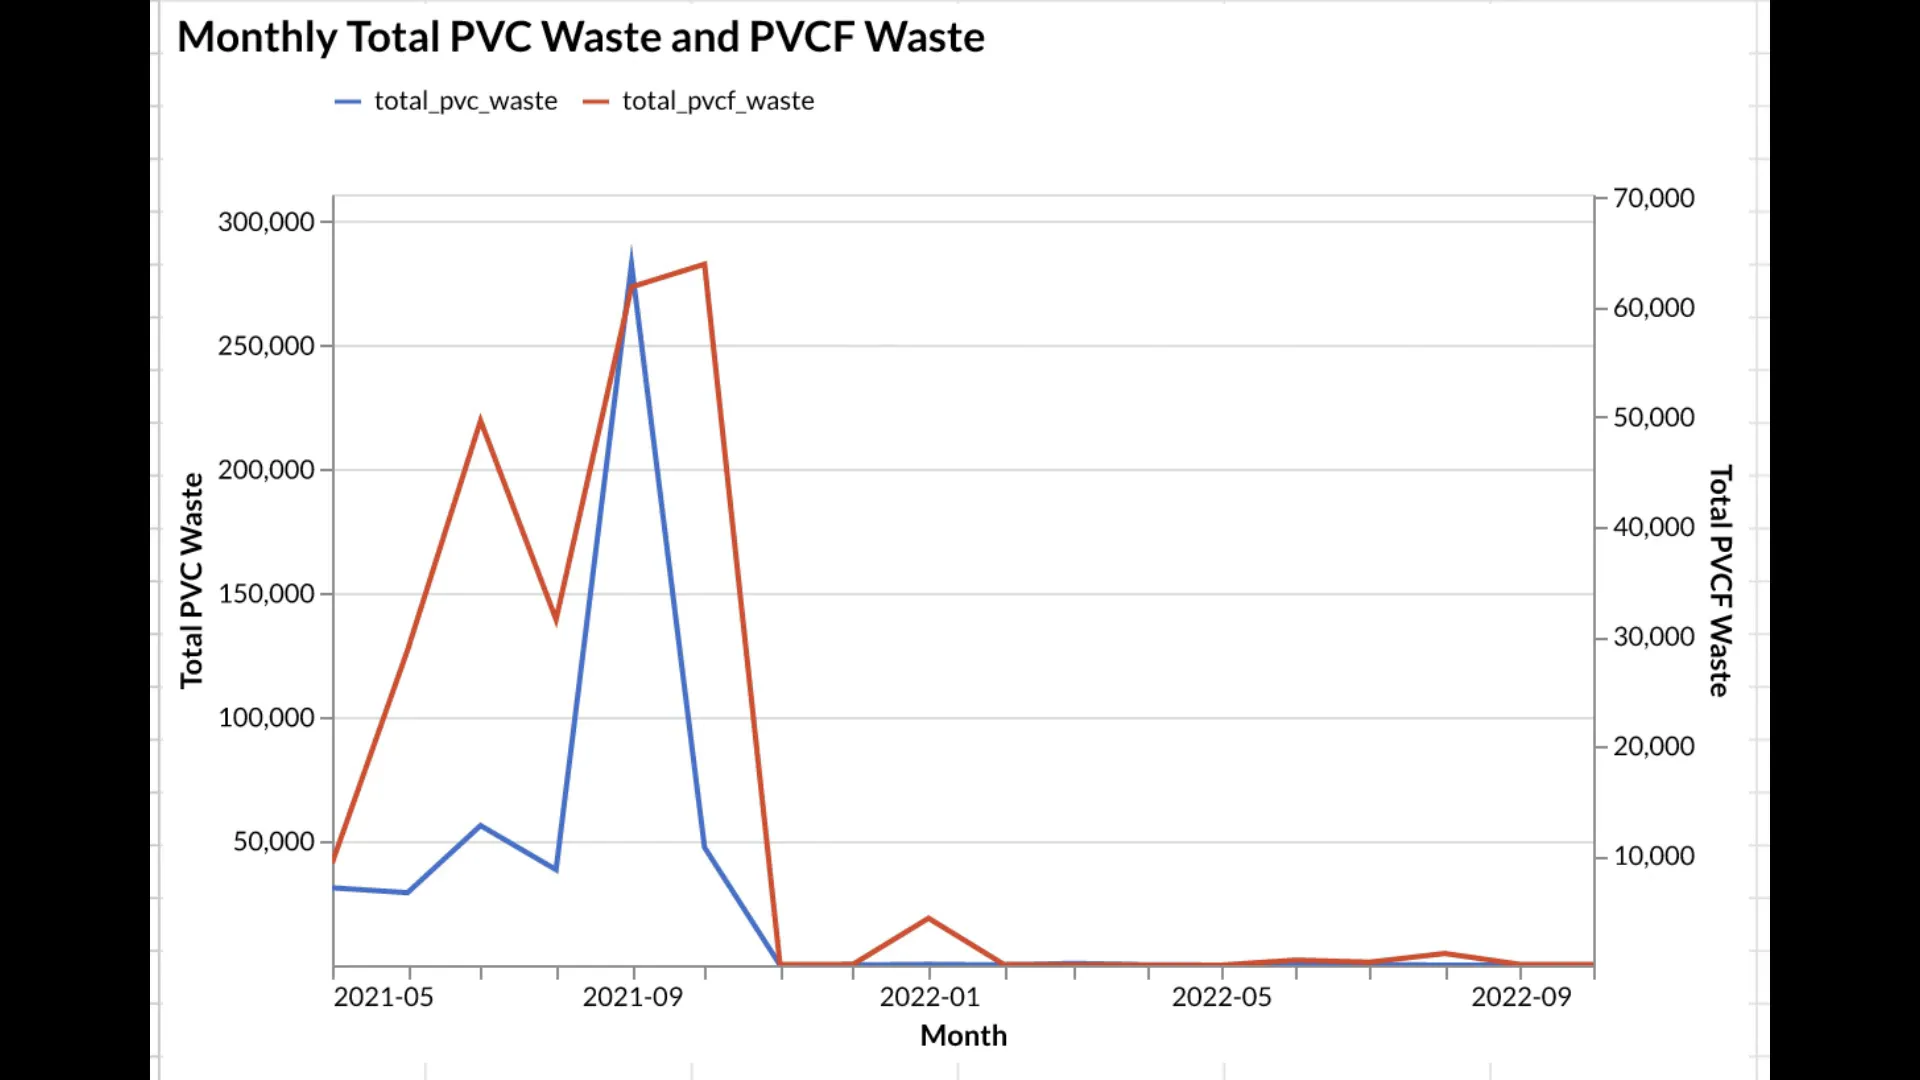
Addressing Waste and Improving Processes
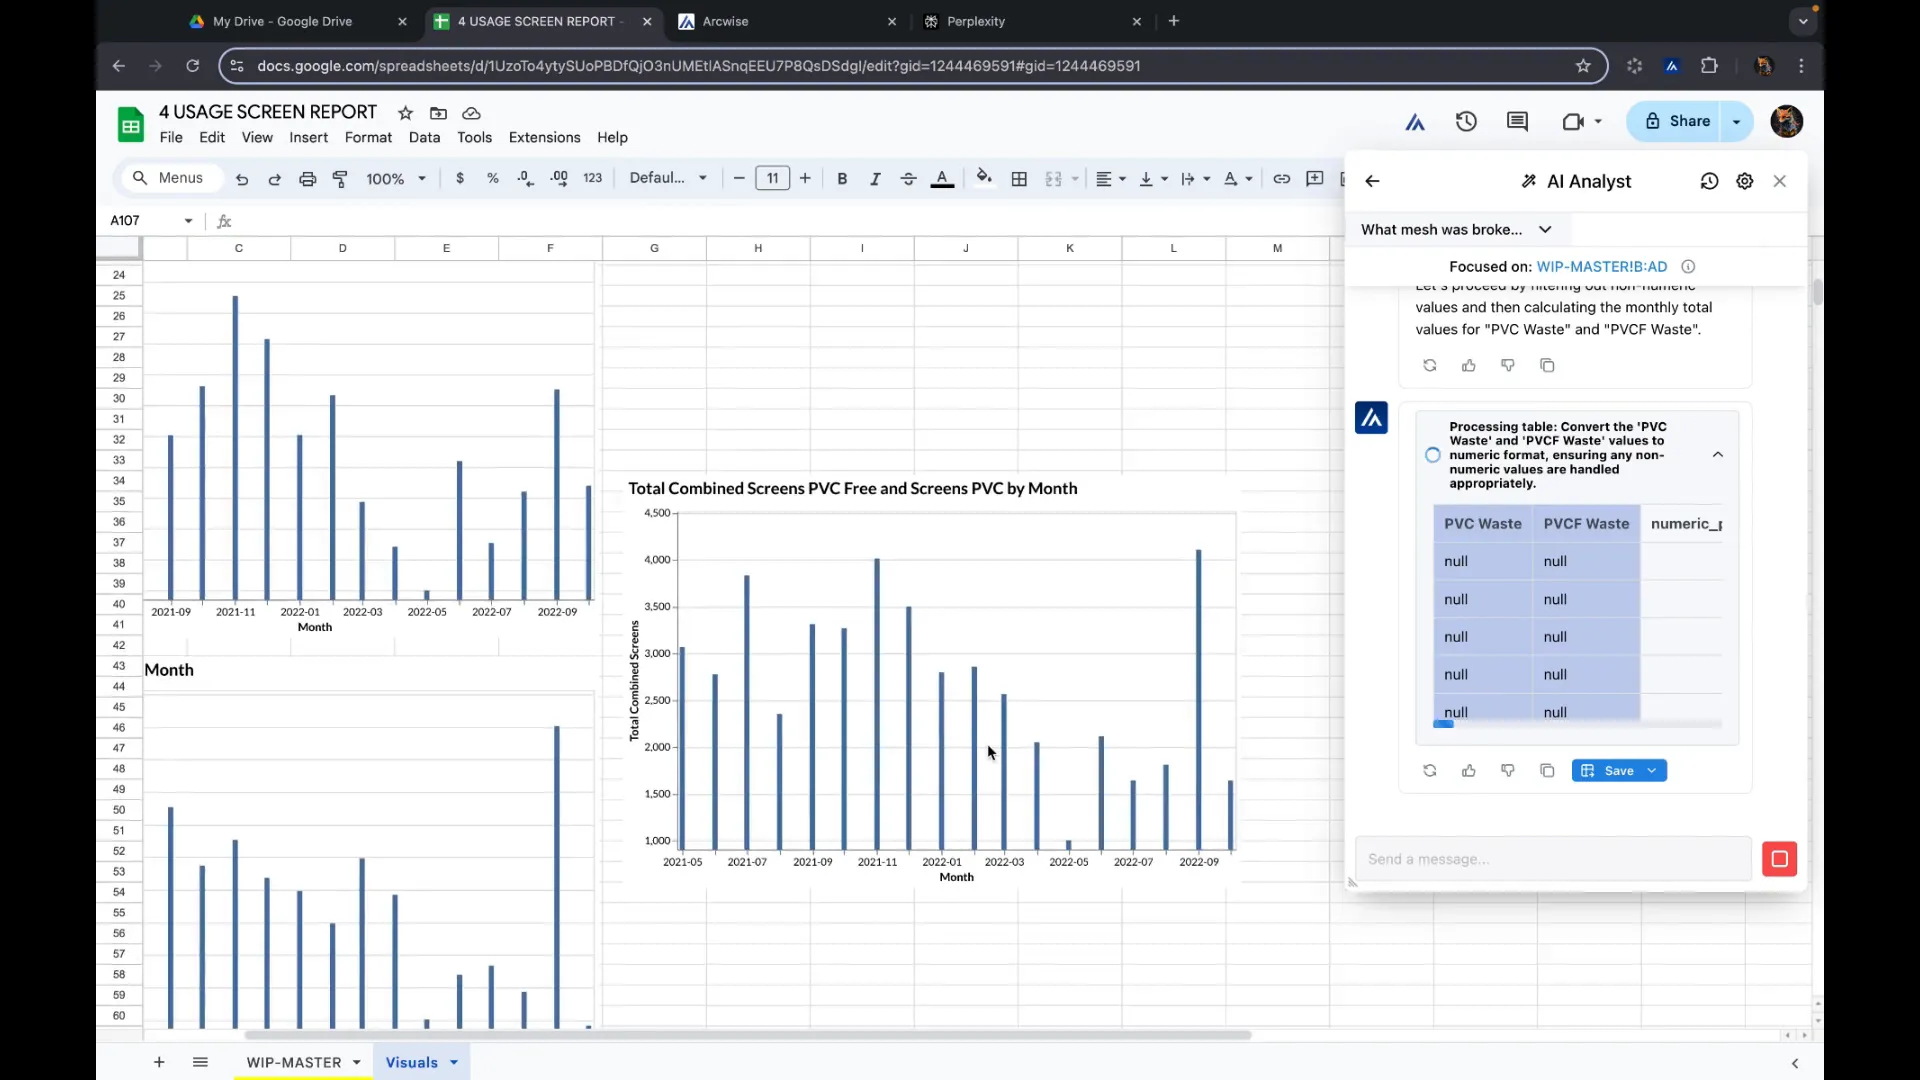
Tracking waste is essential for continuous improvement. Data visualizations can reveal trends in waste reduction, showing how training and procedural changes have led to significant improvements. For instance, a chart demonstrating the reduction in PVC waste can highlight the effectiveness of new operating procedures.
Data Encryption and Security Risks
As we integrate AI into our data management systems, data encryption becomes paramount. Protecting sensitive information from unauthorized access is critical, especially when dealing with proprietary production data. Encryption ensures that only authorized personnel can access and decipher sensitive information, safeguarding intellectual property.

Conclusion
In summary, data cleaning and analysis are crucial components of effective production management. By leveraging AI tools, organizations can enhance their data management processes, improve predictive capabilities, and ultimately drive productivity. As we continue to integrate AI into our operations, prioritizing data security through encryption will be essential to protect sensitive information.
Made with VideoToBlog


Comments