Gildan recently released their 3rd quarter financial report. My take-away for our industry is that they have record sales and substantial profits in activewear. They are not hurting from supply chain or inflation issues as one might have imagined.
You can read the entire press release below.
Gildan Press Release
Gildan Activewear Reports Strong Results for the Third Quarter of 2022
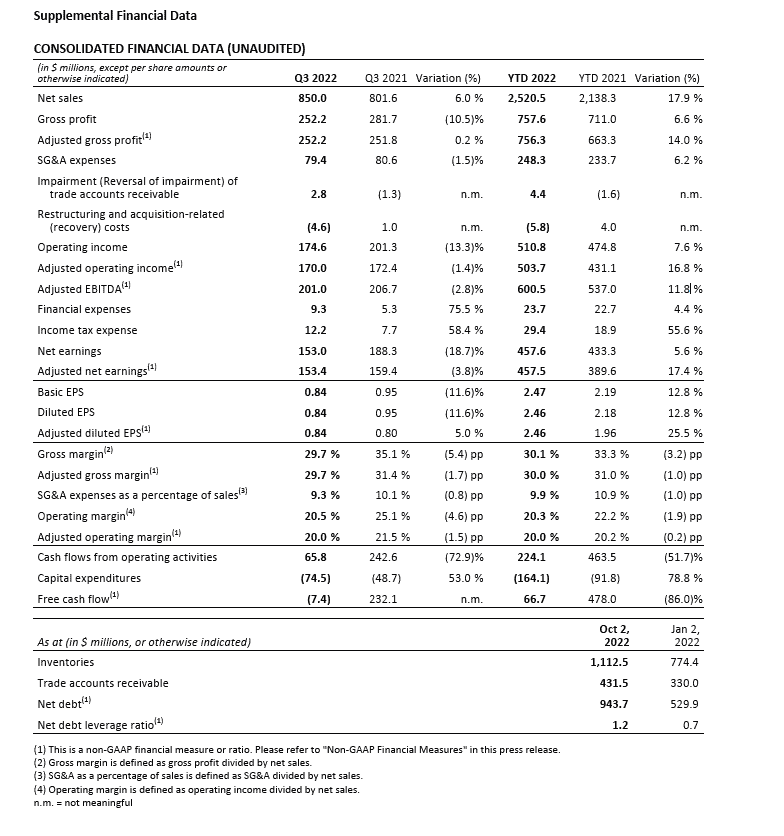
• Record third quarter sales of $850 million, up 6% over prior year
• Strong operating margin of 20.5% and adjusted operating margin1 of 20.0%
• GAAP and adjusted diluted EPS1 of $0.84, with adjusted EPS up 5% year-over-year
• $125 million of capital returned to shareholders during the quarter through dividends and share repurchases
Montreal, Thursday, November 3, 2022 – Gildan Activewear Inc. (GIL: TSX and NYSE) today announced results for the
third quarter ended October 2, 2022.
“The strength of our activewear business, driven by North American imprintables sales, together with the benefits from
our vertically-integrated manufacturing model, allowed us to deliver another strong quarter” said Glenn J. Chamandy,
Gildan’s President and CEO. “These results are a testament to the progress we are making under the Gildan Sustainable
Growth strategy, which we remain fully focused on as we continue to drive to deliver on our three-year targets.”
We generated record third quarter sales of $850 million, up 6% year-over-year, as activewear sales to North American
imprintable distributors held up well in the quarter, driven by higher net selling prices and sales volumes. We also
delivered strong gross margin performance of 29.7% in the quarter, despite inflationary cost pressures, and SG&A came
in better than anticipated at 9.3% of sales, resulting in operating and adjusted operating margins of 20.5% and 20.0%,
respectively, at the high end of our target range. With record sales and strong margin performance in the quarter,
GAAP and adjusted diluted EPS totaled $0.84, with adjusted diluted EPS up 5% over the prior year. After funding higher
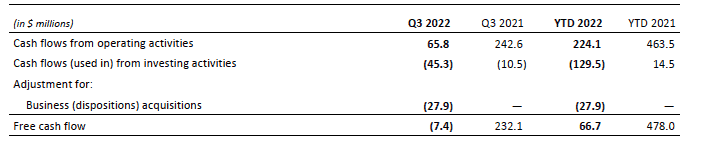
working capital requirements, primarily related to higher inventories, we generated cash flows from operating activities
in the quarter of $66 million which were used to fund higher capital expenditures, resulting in approximately $7 million
of free cash flow1 consumed in the quarter. During the third quarter, we repurchased approximately 3.2 million shares
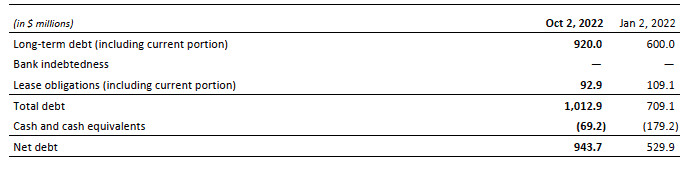
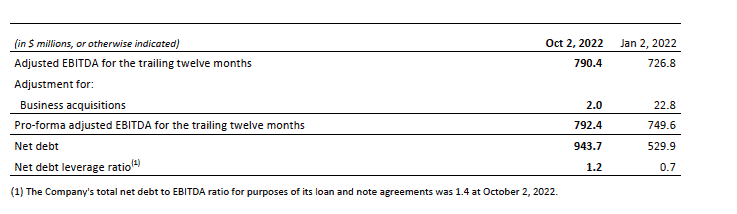
under our normal course issuer bid (NCIB) programs. We ended the quarter with net debt1 of $944 million, bringing our
net debt leverage ratio1 to 1.2, at the lower end of the Company’s target range.
Q3 2022 Operating Results
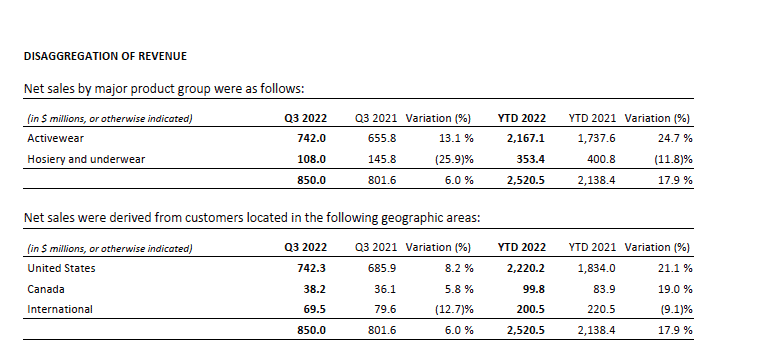
Net sales for the third quarter ended October 2, 2022, were $850 million, up from $802 million in the third quarter last
year and consisted of activewear sales of $742 million, up 13%, and sales in the hosiery and underwear category of
$108 million, down 26% over the prior year. The increase in activewear sales was due to higher net selling prices, partly
offset by lower sales volumes, as increased unit sales to North American distributors were more than offset by lower
unit sales volumes of activewear stemming from demand weakness in retail and international markets. In the hosiery
and underwear category, the sales decline compared to last year was driven by weak demand in retail and the impact
of retailers managing their inventory levels.
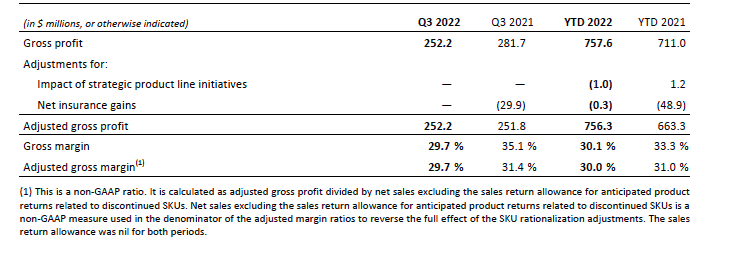
We generated gross and adjusted gross profit1 of $252 million in the quarter, down $30 million from gross profit of
$282 million last year. After adjusting for the benefit of a net insurance gain of approximately $30 million recorded in
the third quarter of 2021, adjusted gross profit was flat year over year, as the sales growth in the quarter was offset by
lower gross and adjusted gross margin1 compared to last year. Although we have been able to sustain strong margin
performance, gross and adjusted gross margins of 29.7% in the quarter were down 540 basis points and 170 basis
points, respectively, compared to last year. The decline in gross margin on a GAAP basis included the impact of the nonrecurrence
of a net insurance gain which benefited gross margin last year by close to 375 basis points. Excluding this
impact, the gross margin and adjusted gross margin decline reflected the impact of higher raw material and other
manufacturing costs, offset in part by higher net selling prices and favourable product mix.
SG&A expenses for the third quarter totaled $79 million, down slightly from $81 million in the same quarter last year,
as lower variable compensation expenses and our cost containment efforts more than offset the impact of cost
inflation and higher selling expenses. SG&A expenses as a percentage of net sales improved 80 basis points to 9.3%
compared to 10.1% last year, as the benefit of lower variable compensation costs and sales leverage more than offset
the impact of cost inflation.
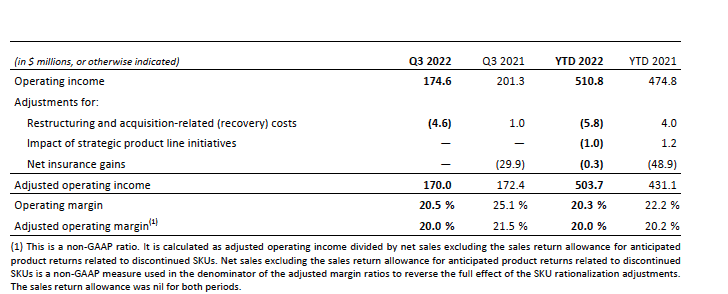
We generated operating income of $175 million, or 20.5% of sales in the quarter and adjusted operating income1 of
$170 million, or 20.0% of sales, compared to operating income of $201 million, or 25.1% of sales, and adjusted
operating income of $172 million, or 21.5% of sales in the third quarter last year. The decrease in GAAP and adjusted
operating income was primarily due to lower operating margins, which more than offset the growth in sales. On a
GAAP basis, the operating income decline also reflected the non-recurrence of the approximate $30 million net
insurance gain recognized in the third quarter last year. After reflecting increased net financial expenses due to higher
interest rates and average borrowing levels and higher GAAP income taxes, as well as the benefit of a lower
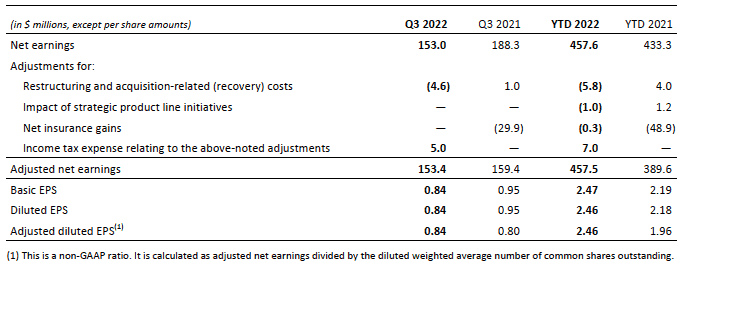
outstanding share base, we reported GAAP and adjusted diluted EPS for the quarter of $0.84, down from GAAP diluted
EPS of $0.95, but up 5% on an adjusted basis compared to $0.80 in the third quarter of 2021.
Our cash flows from operating activities in the third quarter totaled $66 million and after higher capital expenditures
compared to the third quarter last year, we consumed approximately $7 million of free cash flow in the quarter. This
compared to free cash flow of $232 million generated in the third quarter of 2021. The decrease in free cash flow
reflected higher inventory levels including the impact of higher unit costs, planned increases in capital expenditures
which are tracking in line with our target range of 6% to 8% of annual sales and the impact of the non-recurrence of the
approximate $30 million net cash benefit from insurance proceeds received in the third quarter last year. The increase
in capital expenditures primarily relate to capacity projects, including expenditures for the construction of our new
large-scale vertically-integrated textile and sewing facility in Bangladesh which is currently underway. The Company
ended the third quarter of 2022 with net debt of $944 million and a leverage ratio of 1.2 times net debt to trailing
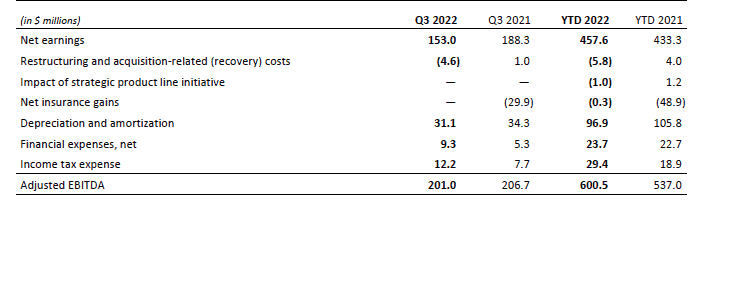
twelve months adjusted EBITDA1.
Year-to-date Operating Results
Net sales for the nine months ended October 2, 2022, were $2,520 million, up 18% over the same period last year,
reflecting an increase of 25% in activewear sales, partly offset by a decline of 12% in the hosiery and underwear
category. The year-over-year increase in activewear sales where we generated sales of $2,167 million was primarily
driven by higher net selling prices, higher unit sales volumes and favourable product-mix. Activewear volume growth
reflected the meaningful recovery in demand from COVID-19, particularly in the first half of the year, and our ability to
better service demand this year due to stronger inventory levels as compared to the prior year, which were impacted
by the hurricanes in Central America in 2020 and yarn labour shortages. The decline in the hosiery and underwear
category, where we generated sales of $353 million in the first nine months of 2022, primarily reflected the impact of
lower unit sales volumes due to weaker demand in retail and the continued impact of tight inventory management at
the retailer level.
For the first nine months of 2022, we generated gross profit of $758 million, or 30.1% of sales compared to gross profit
of $711 million, or 33.3% of sales for the same period last year. On an adjusted basis, gross profit totaled $756 million,
or 30.0% of sales compared to adjusted gross profit of $663 million, or 31.0% of sales in the same period last year. The
$47 million and $93 million increase in gross and adjusted gross profit, respectively, was primarily driven by the 18%
growth in sales, partly offset by gross and adjusted gross margin declines of 320 and 100 basis points, respectively,
compared to the same period last year. Lower gross and adjusted gross margins were primarily the result of higher raw
material and other manufacturing costs and the impact of the non-recurrence of an $18 million (or 85 basis points)
one-time USDA cotton subsidy in connection to its Pandemic Assistance for Cotton Users program which was recorded
in the first quarter of 2021. The unfavourable impact of these factors was partly offset by the benefit of higher net
selling prices and product-mix. The year-over-year decline in gross margin on a GAAP basis also reflected the impact of
the non-recurrence of net insurance gains of approximately $49 million or 230 basis points recognized in the first nine
months of last year.
SG&A expenses in the first nine months of 2022 totaled $248 million, or 9.9% of sales, up $14 million from $234 million,
or 10.9% of sales, in the same period last year. The increase in SG&A expenses was primarily due to higher selling
expenses and the impact of inflation on overall costs, partially offset by lower variable compensation expenses and the
benefit of our cost containment measures. As a percentage of sales, the 100 basis point improvement in SG&A
expenses primarily reflected the benefit of sales leverage.
On a year-to-date basis, we generated operating income of $511 million or 20.3% of sales, up from $475 million or
22.2% of sales in the same period last year. On an adjusted basis, we generated operating income1 of $504 million,
which translated to a year-to-date operating margin of 20.0% compared to $431 million and 20.2%, respectively, last
year. The increase in operating and adjusted operating income for the first nine months of 2022 was driven primarily by
the 18% year-to-date increase in sales, partly offset by lower operating margins. The year-to-date 190 basis-point
decline in operating margin and slight decrease of 20 basis points on an adjusted basis largely reflected lower gross
margins which offset the benefit of SG&A leverage. As a result, our GAAP and adjusted net earnings1 for the first nine
months of 2022 came in at $458 million, up 6% and 17%, respectively, compared to last year. Year-to-date GAAP and
adjusted diluted EPS totaled $2.46, up 13% and 26%, respectively compared to diluted EPS of $2.18 and adjusted
diluted EPS of $1.96 last year, the increases of which also reflected the benefit of share repurchases made under the
Company’s NCIB programs.
Outlook
We believe our business and the actions we have taken continue to position us well to navigate through any near-term
challenges related to the current environment. Importantly, our large North American business geared toward
imprintables channels continues to benefit from demand driven by travel, tourism and large events and is expected to
remain relatively stable. On the other hand, where we are seeing continued weakness is with our national account or
retail-related customers, which represents a smaller part of our business. Further, in international markets we are also
continuing to see ongoing softness in demand. On the cost side, although the impact of higher raw material costs will
become more pronounced in the fourth quarter, we remain focused on delivering on our operating profitability target
range of 18% to 20%. More importantly, our proven operational excellence in both good and tough environments as
well as the progress we continue to make on the key pillars of our sustainable growth strategy, gives us confidence in
our ability to deliver on our three-year growth targets outlined in February of this year.
Declaration of Quarterly Dividend
The Board of Directors has declared a cash dividend of $0.169 per share, payable on December 19, 2022 to
shareholders of record as of November 23, 2022. This dividend is an “eligible dividend” for the purposes of the Income
Tax Act (Canada) and any other applicable provincial legislation pertaining to eligible dividends.
Renewal of Normal Course Issuer Bid
During the third quarter, the Company completed share repurchases under its NCIB ending August 8, 2022 and
following the renewal of the Company’s NCIB, effective August 9, 2022, the Company continued to repurchase shares.
A total of 3,200,000 common shares were repurchased for cancellation during the third quarter at a total cost of
approximately $96 million.
Gildan’s management and the Board of Directors believe the repurchase of common shares represents an appropriate
use of Gildan’s financial resources and that share repurchases under the NCIB will not preclude Gildan from continuing
to pursue organic growth and complementary acquisitions.
Disclosure of Outstanding Share Data
As at October 28, 2022, there were 179,561,295 common shares issued and outstanding along with 3,181,527 stock
options and 66,657 dilutive restricted share units (Treasury RSUs) outstanding. Each stock option entitles the holder to
purchase one common share at the end of the vesting period at a predetermined exercise price. Each Treasury RSU
entitles the holder to receive one common share from treasury at the end of the vesting period, without any monetary
consideration being paid to the Company.
This release should be read in conjunction with Gildan’s Management’s Discussion and Analysis and its unaudited
condensed interim consolidated financial statements as at and for the three and nine months ended October 2, 2022,
which will be filed by Gildan with the Canadian securities regulatory authorities and with the U.S. Securities and
Exchange Commission and which will be available on Gildan’s corporate website.
Certain minor rounding variances may exist between the condensed consolidated financial statements and the table
summaries contained in this press release.
Non-GAAP financial measures and related ratios
This press release includes references to certain non-GAAP financial measures, as well as non-GAAP ratios as described
below. These non-GAAP measures do not have any standardized meanings prescribed by International Financial
Reporting Standards (IFRS) and are therefore unlikely to be comparable to similar measures presented by other
companies. Accordingly, they should not be considered in isolation or as a substitute for measures of performance
prepared in accordance with IFRS. The terms and definitions of the non-GAAP measures used in this press release and a
reconciliation of each non-GAAP measure to the most directly comparable IFRS measure are provided below.
Certain adjustments to non-GAAP measures
As noted above certain of our non-GAAP financial measures and ratios exclude the variation caused by certain
adjustments that affect the comparability of the Company’s financial results and could potentially distort the analysis of
trends in its business performance. Adjustments which impact more than one non-GAAP financial measure and ratio
are explained below:
Restructuring and acquisition-related (recovery) costs
Restructuring and acquisition-related costs are comprised of costs directly related to significant exit activities, including
the closure and sale of business locations or the relocation of business activities, significant changes in management
structure, as well as transaction, exit, and integration costs incurred pursuant to business acquisitions. Restructuring
and acquisition-related costs is included as an adjustment in arriving at adjusted operating income, adjusted operating
margin, adjusted net earnings, adjusted diluted EPS, and adjusted EBITDA. For the three and nine months ended
October 2, 2022 restructuring and acquisition-related recoveries of $4.6 million and $5.8 million (2021 – $1.0 million
and $4.0 million in costs) respectively were recognized. Refer to subsection 5.4.5 entitled “Restructuring and
acquisition-related (recovery) costs” in our interim MD&A for a detailed discussion of these costs and recoveries.
Net insurance gains
For the three and nine months ended October 2, 2022, net insurance gains were nil and $0.3 million (2021 – $29.9
million and $48.9 million), related to the two hurricanes which impacted the Company’s operations in Central America
in November 2020. The net insurance gains reflected a recovery of $2.0 million and costs of $6.0 million (2021 –
$11.0 million and $50.6 million) (mainly attributable to equipment repairs, salary and benefits continuation for idle
employees, and other costs and charges), which were more than offset by related accrued insurance write-offs of $2.0
million and recoveries of $6.3 million (2021 – $40.9 million and $99.5 million) during the three and nine months ended
October 2, 2022. The insurance gains primarily relate to accrued insurance recoveries at replacement cost value for
damaged equipment in excess of the write-off of the net book value of property plant and equipment, as well as the
recognition of insurance recoveries for business interruption, when applicable. Net insurance gains are included as an
adjustment in arriving at adjusted gross profit and adjusted gross margin, adjusted operating income, adjusted
operating margin, adjusted net earnings, adjusted diluted EPS, and adjusted EBITDA.
Impact of strategic product line initiatives
In the fourth quarter of fiscal 2019, the Company launched a strategic initiative to significantly reduce its imprintables
product line SKU count. In the fourth quarter of fiscal 2020 the Company expanded this strategic initiative to include a
significant reduction in its retail product line SKU count. The objectives of this strategic initiative include exiting all ship
to-the-piece activities, discontinuing overlapping and less productive styles and SKUs between brands, simplifying the
Company’s product portfolio and reducing complexity in its manufacturing and warehouse distribution activities. The
impact of this initiative has included inventory write-downs to reduce the carrying value of discontinued SKUs to
liquidation values, sales return allowances for product returns related to discontinued SKUs, and in Q4 2021, the writedown
of production equipment and other assets relating to discontinued SKUs. The impact of strategic product line
initiatives is included as an adjustment in arriving at adjusted gross profit and adjusted gross margin, adjusted
operating income, adjusted operating margin, adjusted net earnings, adjusted diluted EPS, and adjusted EBITDA.
The gains and charges related to this initiative were as follows:
• For the three and nine months ended October 2, 2022, nil and $1.0 million of recoveries included in cost of
sales.
• For the three and nine months ended October 3, 2021, nil and $1.2 million of charges included in cost of sales.
Adjusted net earnings and adjusted diluted EPS
Adjusted net earnings are calculated as net earnings before restructuring and acquisition-related costs, impairment of
goodwill and intangible assets (and reversal of impairments on intangible assets), net insurance gains, the
discontinuance of PPE SKUs, the impact of the Company’s strategic product line initiatives, and income tax expense or
recovery relating to these items. Adjusted net earnings also excludes income taxes related to the re-assessment of the
probability of realization of previously recognized or de-recognized deferred income tax assets, and income taxes
relating to the revaluation of deferred income tax assets and liabilities as a result of statutory income tax rate changes
in the countries in which we operate. Adjusted diluted EPS is calculated as adjusted net earnings divided by the diluted
weighted average number of common shares outstanding. The Company uses adjusted net earnings and adjusted
diluted EPS to measure its net earnings performance from one period to the next, and in making decisions regarding
the ongoing operations of its business, without the variation caused by the impacts of the items described above. The
Company excludes these items because they affect the comparability of its net earnings and diluted EPS and could
potentially distort the analysis of net earnings trends in its business performance. The Company believes adjusted net
earnings and adjusted diluted EPS are useful to investors because they help identify underlying trends in our business
that could otherwise be masked by certain expenses, write-offs, charges, income or recoveries that can vary from
period to period. Excluding these items does not imply they are necessarily non-recurring. These measures do not have
any standardized meanings prescribed by IFRS and are therefore unlikely to be comparable to similar measures
presented by other companies.
Adjusted gross profit and adjusted gross margin
Adjusted gross profit is calculated as gross profit excluding the impact of net insurance gains, the discontinuance of PPE
SKUs, and the impact of the Company’s strategic product line initiatives. The Company uses adjusted gross profit and
adjusted gross margin to measure its performance at the gross margin level from one period to the next, without the
variation caused by the impacts of the items described above. The Company excludes these items because they affect
the comparability of its financial results and could potentially distort the analysis of trends in its business performance.
Excluding these items does not imply they are necessarily non-recurring. The Company believes adjusted gross profit
and adjusted gross margin are useful to management and investors because they help identify underlying trends in our
business in how efficiently the Company uses labor and materials for manufacturing goods to our customers, that could
otherwise be masked by the impact of our strategic product line initiatives and net insurance gains that can vary from
period to period. These measures do not have any standardized meanings prescribed by IFRS and are therefore unlikely
to be comparable to similar measures presented by other companies.
Adjusted operating income and adjusted operating margin
Adjusted operating income is calculated as operating income before restructuring and acquisition-related costs.
Adjusted operating income also excludes impairment of goodwill and intangible assets, net insurance gains, the
discontinuance of PPE SKUs, and the impact of the Company’s strategic product line initiatives. Adjusted operating
margin is calculated as adjusted operating income divided by net sales, excluding the sales return allowance for
anticipated product returns related to discontinued SKUs. Management uses adjusted operating income and adjusted
operating margin to measure its performance at the operating income level as we believe it provides a better indication
of our operating performance and facilitates the comparison across reporting periods, without the variation caused by
the impacts of the items described above. The Company excludes these items because they affect the comparability of
its financial results and could potentially distort the analysis of trends in its operating income and operating margin
performance. The Company believes adjusted operating income and adjusted operating margin are useful to investors
because they help identify underlying trends in our business in how efficiently the Company generates profit from its
primary operations that could otherwise be masked by the impact of restructuring and acquisition-related costs, our
strategic product line initiatives and net insurance gains that can vary from period to period. Excluding these items
does not imply they are necessarily non-recurring. These measures do not have any standardized meanings prescribed
by IFRS and are therefore unlikely to be comparable to similar measures presented by other companies.
Adjusted EBITDA
Adjusted EBITDA is calculated as earnings before financial expenses net, income taxes, and depreciation and
amortization, and excludes the impact of restructuring and acquisition-related costs. Adjusted EBITDA also excludes
impairment of goodwill and intangible assets and reversal of impairments on intangible assets, net insurance gains, the
discontinuance of PPE SKUs, and the impact of the Company’s strategic product line initiative. Management uses
adjusted EBITDA, among other measures, to facilitate a comparison of the profitability of its business on a consistent
basis from period-to-period and to provide a more complete understanding of factors and trends affecting our
business. The Company also believes this measure is commonly used by investors and analysts to assess profitability
and the cost structure of companies within the industry, as well as measure a company’s ability to service debt and to
meet other payment obligations, or as a common valuation measurement. The Company excludes depreciation and
amortization expenses, which are non-cash in nature and can vary significantly depending upon accounting methods or
non-operating factors. Excluding these items does not imply they are necessarily non-recurring. This measure does not
have any standardized meanings prescribed by IFRS and is therefore unlikely to be comparable to similar measures
presented by other companies.
Free cash flow
Free cash flow is defined as cash from operating activities, less cash flow used in investing activities excluding cash
flows relating to business acquisitions/dispositions. The Company considers free cash flow to be an important indicator
of the financial strength and liquidity of its business, and it is a key metric used by management in managing capital as
it indicates how much cash is available after capital expenditures to repay debt, to pursue business acquisitions, and/or
to redistribute to its shareholders. Management believes that free cash flow also provides investors with an important
perspective on the cash available to us to service debt, fund acquisitions, and pay dividends. In addition, free cash flow
is commonly used by investors and analysts when valuing a business and its underlying assets. This measure does not
have any standardized meanings prescribed by IFRS and is therefore unlikely to be comparable to similar measures
presented by other companies.
Total debt and net debt
Total debt is defined as the total bank indebtedness, long-term debt (including any current portion), and lease
obligations (including any current portion), and net debt is calculated as total debt net of cash and cash equivalents.
The Company considers total debt and net debt to be important indicators for management and investors to assess the
financial position and liquidity of the Company, and measure its financial leverage. These measures do not have any
standardized meanings prescribed by IFRS and are therefore unlikely to be comparable to similar measures presented
by other companies.
Net debt leverage ratio
The net debt leverage ratio is defined as the ratio of net debt to pro-forma adjusted EBITDA for the trailing twelve
months, all of which are non-GAAP measures. The pro-forma adjusted EBITDA for the trailing twelve months reflects
business acquisitions made during the period, as if they had occurred at the beginning of the trailing twelve month
period. The Company has set a fiscal year-end net debt leverage target ratio of one to two times pro-forma adjusted
EBITDA for the trailing twelve months. The net debt leverage ratio serves to evaluate the Company’s financial leverage
and is used by management in its decisions on the Company’s capital structure, including financing strategy. The
Company believes that certain investors and analysts use the net debt leverage ratio to measure the financial leverage
of the Company, including our ability to pay off our incurred debt. The Company’s net debt leverage ratio differs from
the net debt to EBITDA ratio that is a covenant in our loan and note agreements due primarily to adjustments in the
latter related to lease accounting, and therefore the Company believes it is a useful additional measure. This measure
does not have any standardized meanings prescribed by IFRS and is therefore unlikely to be comparable to similar
measures presented by other companies.
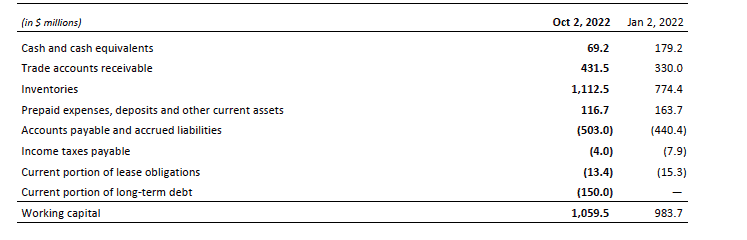
Working capital
Working capital is a non-GAAP financial measure and is defined as current assets less current liabilities. Management
believes that working capital, in addition to other conventional financial measures prepared in accordance with IFRS,
provides information that is helpful to understand the financial condition of the Company. The objective of using
working capital is to present readers with a view of the Company from management’s perspective by interpreting the
material trends and activities that affect the short-term liquidity and financial position of the Company, including its
ability to discharge its short-term liabilities as they come due. This measure is not necessarily comparable to similarly
titled measures used by other public companies.
Caution Concerning Forward-Looking Statements
Certain statements included in this press release constitute “forward-looking statements” within the meaning of the
U.S. Private Securities Litigation Reform Act of 1995 and Canadian securities legislation and regulations and are subject
to important risks, uncertainties, and assumptions. This forward-looking information includes, amongst others,
information with respect to our objectives and the strategies to achieve these objectives, as well as information with
respect to our beliefs, plans, expectations, anticipations, estimates, and intentions, including, without limitation, our
expectation with regards to net sales, gross margin, SG&A expenses, restructuring and acquisition-related costs,
operating margin, adjusted operating margin, adjusted EBITDA, diluted earnings per share, adjusted diluted earnings
per share, income tax rate, free cash flow, return on adjusted average net assets, net debt to adjusted EBITDA leverage
ratios, capital return and capital investments or expenditures, including our three-year financial outlook referenced in
this press release under the section “Outlook”. Forward-looking statements generally can be identified by the use of
conditional or forward-looking terminology such as “may”, “will”, “expect”, “intend”, “estimate”, “project”, “assume”,
“anticipate”, “plan”, “foresee”, “believe”, or “continue”, or the negatives of these terms or variations of them or similar
terminology. We refer you to the Company’s filings with the Canadian securities regulatory authorities and the U.S.
Securities and Exchange Commission, as well as the risks described under the “Financial risk management”, “Critical
accounting estimates and judgments”, and “Risks and uncertainties” sections of our most recent Management’s
Discussion and Analysis for a discussion of the various factors that may affect the Company’s future results. Material
factors and assumptions that were applied in drawing a conclusion or making a forecast or projection are also set out
throughout such document and this press release.
Forward-looking information is inherently uncertain and the results or events predicted in such forward-looking
information may differ materially from actual results or events. Material factors, which could cause actual results or
Page 11
events to differ materially from a conclusion, forecast, or projection in such forward-looking information, include, but
are not limited to:
• the magnitude and length of economic disruption as a result of the worldwide coronavirus (COVID-19)
pandemic and the appearance of COVID variants, including the scope and duration of government mandated
general, partial, or targeted private sector shutdowns, travel restrictions, social distancing measures, and the
pace of mass vaccination campaigns;
• changes in general economic and financial conditions globally or in one or more of the markets we serve,
including those resulting from the impacts of the COVID-19 pandemic and the appearance of COVID variants,
the current high inflationary environment and the ongoing Russia-Ukraine conflict and war;
• our ability to implement our growth strategies and plans, including our ability to bring projected capacity
expansion online;
• our ability to successfully integrate acquisitions and realize expected benefits and synergies;
• the intensity of competitive activity and our ability to compete effectively;
• our reliance on a small number of significant customers;
• the fact that our customers do not commit to minimum quantity purchases;
• our ability to anticipate, identify, or react to changes in consumer preferences and trends;
• our ability to manage production and inventory levels effectively in relation to changes in customer demand;
• fluctuations and volatility in the price of raw materials used to manufacture our products, such as cotton,
polyester fibers, dyes and other chemicals from current levels;
• our reliance on key suppliers and our ability to maintain an uninterrupted supply of raw materials,
intermediate materials and finished goods;
• the impact of climate, political, social, and economic risks, natural disasters, epidemics, pandemics and
endemics, such as the COVID-19 pandemic, in the countries in which we operate or sell to, or from which we
source production;
• disruption to manufacturing and distribution activities due to such factors as operational issues, disruptions in
transportation logistic functions, labour shortages or disruptions, political or social instability, weather-related
events, natural disasters, epidemics and pandemics, such as the COVID-19 pandemic, and other unforeseen
adverse events;
• the impacts of the COVID-19 pandemic on our business and financial performance and consequently on our
ability to comply with the financial covenants under our debt agreements;
• compliance with applicable trade, competition, taxation, environmental, health and safety, product liability,
employment, patent and trademark, corporate and securities, licensing and permits, data privacy, bankruptcy,
anti-corruption, and other laws and regulations in the jurisdictions in which we operate;
• the imposition of trade remedies, or changes to duties and tariffs, international trade legislation, bilateral and
multilateral trade agreements and trade preference programs that the Company is currently relying on in
conducting its manufacturing operations or the application of safeguards thereunder;
• factors or circumstances that could increase our effective income tax rate, including the outcome of any tax
audits or changes to applicable tax laws or treaties, including the implementation of a global minimum tax
rate;
• changes to and failure to comply with consumer product safety laws and regulations;
• changes in our relationship with our employees or changes to domestic and foreign employment laws and
regulations;
• negative publicity as a result of actual, alleged, or perceived violations of human rights, labour and
environmental laws or international labour standards, or unethical labour or other business practices by the
Company or one of its third-party contractors;
• changes in third-party licensing arrangements and licensed brands;
• our ability to protect our intellectual property rights;
• operational problems with our information systems as a result of system failures, viruses, security and cyber
security breaches, disasters, and disruptions due to system upgrades or the integration of systems;
• an actual or perceived breach of data security;
• our reliance on key management and our ability to attract and/or retain key personnel;
• changes in accounting policies and estimates; and
• exposure to risks arising from financial instruments, including credit risk on trade accounts receivables and
other financial instruments, liquidity risk, foreign currency risk, and interest rate risk, as well as risks arising
from commodity prices.
These factors may cause the Company’s actual performance and financial results in future periods to differ materially
from any estimates or projections of future performance or results expressed or implied by such forward-looking
statements. Forward-looking statements do not take into account the effect that transactions or non-recurring or other
special items announced or occurring after the statements are made may have on the Company’s business. For
example, they do not include the effect of business dispositions, acquisitions, other business transactions, asset writedowns,
asset impairment losses, or other charges announced or occurring after forward-looking statements are made.
The financial impact of such transactions and non-recurring and other special items can be complex and necessarily
depends on the facts particular to each of them.
There can be no assurance that the expectations represented by our forward-looking statements will prove to be
correct. The purpose of the forward-looking statements is to provide the reader with a description of management’s
expectations regarding the Company’s future financial performance and may not be appropriate for other purposes.
Furthermore, unless otherwise stated, the forward-looking statements contained in this report are made as of the date
hereof, and we do not undertake any obligation to update publicly or to revise any of the included forward-looking
statements, whether as a result of new information, future events, or otherwise unless required by applicable
legislation or regulation. The forward-looking statements contained in this report are expressly qualified by this
cautionary statement.
About Gildan
Gildan is a leading manufacturer of everyday basic apparel which markets its products in North America, Europe, Asia
Pacific, and Latin America, under a diversified portfolio of Company-owned brands, primarily including Gildan®,
American Apparel®, Comfort Colors®, GOLDTOE®, Peds®, and under the Under Armour® brand through a sock licensing
agreement for exclusive distribution in the United States and Canada. The Company’s product offerings include
activewear, underwear and socks, sold to wholesale imprintables distributors and national accounts which include large
screenprinters or embellishers, retailers and global lifestyle brand companies.
Gildan owns and operates vertically integrated, large-scale manufacturing facilities which are primarily located in
Central America, the Caribbean, United States, and Bangladesh. Gildan operates with a strong commitment to industryleading
labour, environmental and governance practices throughout its supply chain in accordance with its
comprehensive ESG program embedded in the Company’s long-term business strategy. More information about the
Company and its ESG practices and initiatives can be found at www.gildancorp.com.


Comments