Our weekly report was technically working. Every Monday it generated a PDF with setup times, delay breakdowns, operator stats, problem counts. The team opened it, scanned the numbers, moved on. Nothing changed.
The problem wasn’t the data. It was the isolation. Setup time averaged 35 minutes this week, is that good or bad? Delays totaled 300 minutes, getting worse or improving? Each report existed in a vacuum. Without context, numbers are observations, not insights. The monthly report had week-over-week comparisons, but by the time it showed up the data was stale and the moment to act had passed.
Two additions fixed it
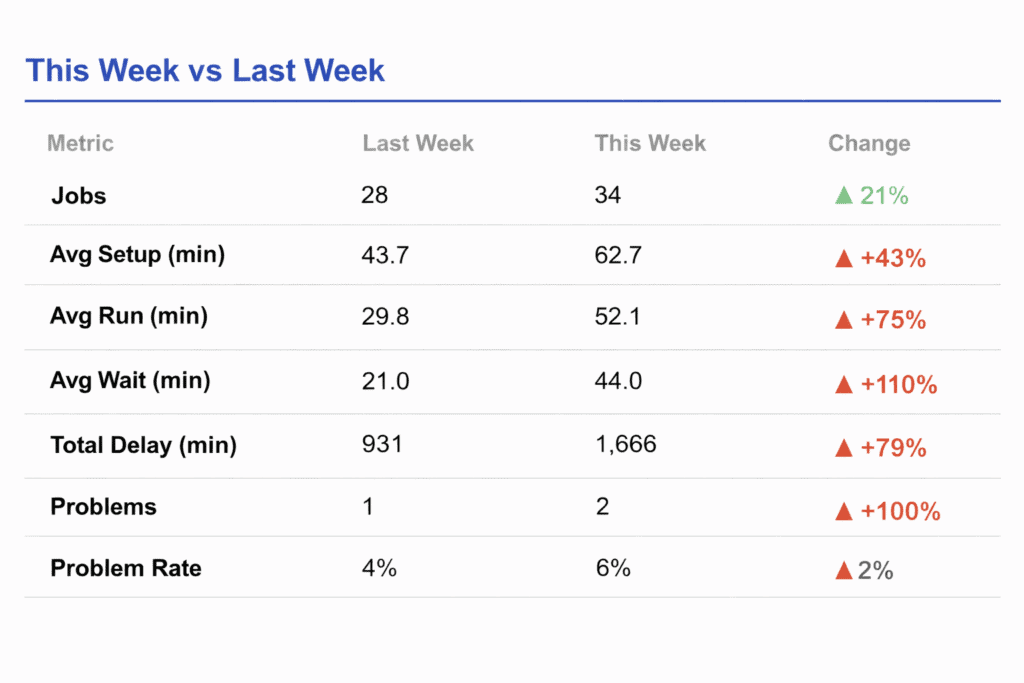
I restructured the weekly report around a “This Week vs Last Week” comparison table and a Year-to-Date running totals section.
The comparison table sits at the top. Key metrics side by side, jobs completed, average setup time, average wait time, total delay minutes, problem count, problem rate, with colored trend arrows. Green down arrow on setup time means improvement. Red up arrow on delays means things got worse. The visual is immediate. No interpretation required.
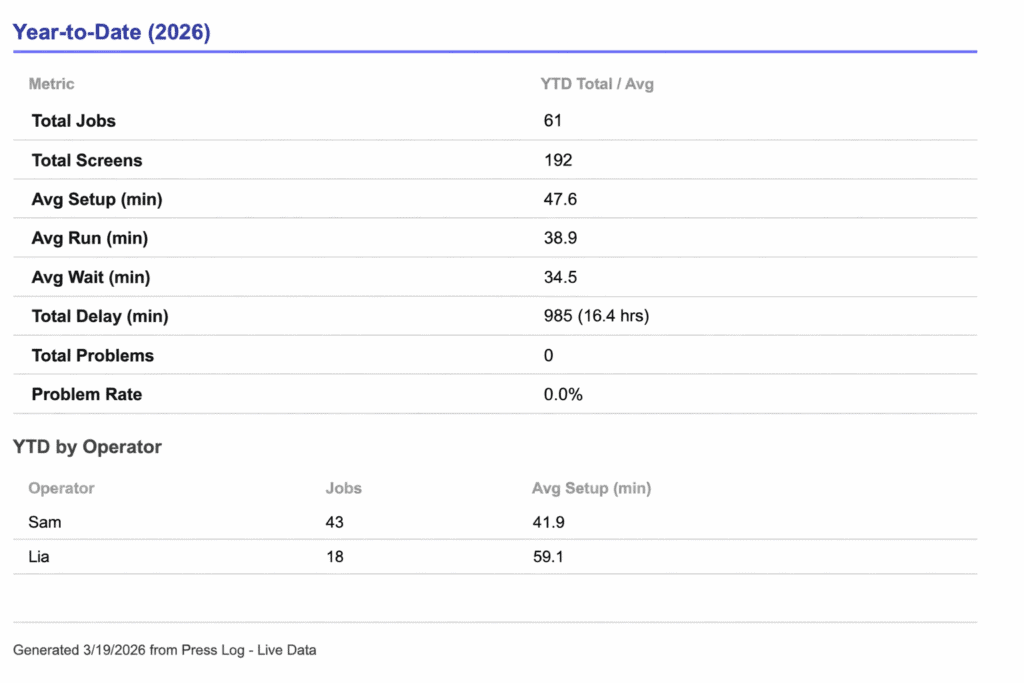
The Year-to-Date section anchors the weekly swings against the bigger picture. A spike in delay time feels different when you can see it against three months of cumulative data versus staring at it alone. It also tracks per-operator running totals, so managers get a longitudinal view of workload and efficiency without waiting for the quarterly report.
Numbers are falsified to protect anonymity.
No new infrastructure
The implementation reuses the same Google Sheets data the report already queries. An analyzeRows helper function processes any filtered set of rows into a standardized metrics object, same logic runs against this week’s data, last week’s data, and the full year. The comparison section diffs two metrics objects and renders the delta with directional formatting. That’s it.
And in layman’s terms:
The whole thing runs on the same Google Sheets data the report was already pulling from. I didn’t build anything new underneath it. There’s one piece of code that knows how to look at any chunk of data, this week, last week, the whole year, and spit out the same set of numbers. The comparison section just puts two of those side by side and shows what went up, what went down, and by how much. That’s it.
What actually changed
The shop owner now opens the report and immediately sees whether the week moved in the right direction. When setup times dropped 12% after adjusting the operator workflow, the next report showed it with a green arrow, instant feedback that the change worked. When delays crept up the following week, it was caught in seven days instead of thirty. The report became a feedback loop instead of a filing obligation.
The part that surprised me
The weekly report script was already several hundred lines of Apps Script generating HTML, calculating metrics, building tables, converting everything to PDF. Modifying a system that complex sounds like a project. Trace the data flow, understand the dependencies, make sure nothing breaks downstream. In practice, it was a conversation. I described what I wanted the report to do differently, Claude understood the existing structure, and produced an updated script that preserved everything already working while adding the new sections. The whole process, discussing the approach, generating the code, testing, took less time than it would have taken me to just read through the original script line by line.
That changes how you think about building these systems. Normally there’s a reluctance to touch something that works. Every modification carries risk, and the cost of change discourages iteration. With AI handling the implementation, the cost of change drops. You stop treating the first version as the final version. The operators gave feedback, we discussed what should change, the report evolved.
I expect this to keep happening. As the data accumulates, new questions will come up. The reports six months from now probably won’t look like the reports today. That’s the point. The system is built to be changed.
Tools used:
- Claude (Opus 4.6 — script modification, approach discussion)
- Google Sheets + Apps Script (data source and report generation)
- Tablet-based production logging system (shop floor data collection)


Comments